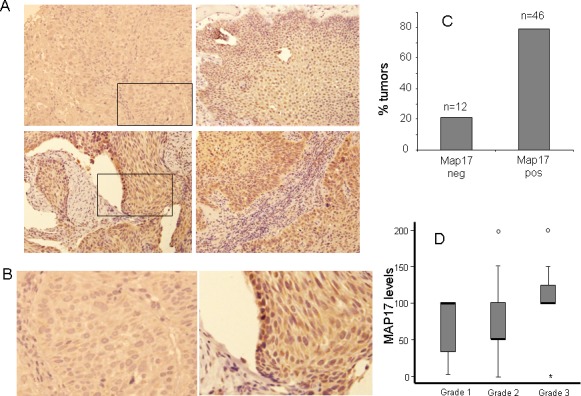
Figure 1. MAP17 overexpression in larynx tumors.

A) Representative images of MAP17 immunostaining are shown for different larynx tumors. B) High magnification of M17 positive and negative tumors. The picture shows a magnification of the inset of figure A. C) A graph is shown representing the percentage of laryngeal tumors with dichotomous MAP17 levels. The score for positive tumors were >62. D) The distribution of the MAP17 expression levels among different grades of larynx tumors is shown. The MAP17 levels (score) refers to maximum levels (0–2) scored by the percentage of cells (0–100). The normalized levels were obtained by multiplying the percentage of cells by the level of intensity observed. Anova test was performed to establish the statistical association between MAP17 protein levels and the grade of the tumor (p<0,05).
