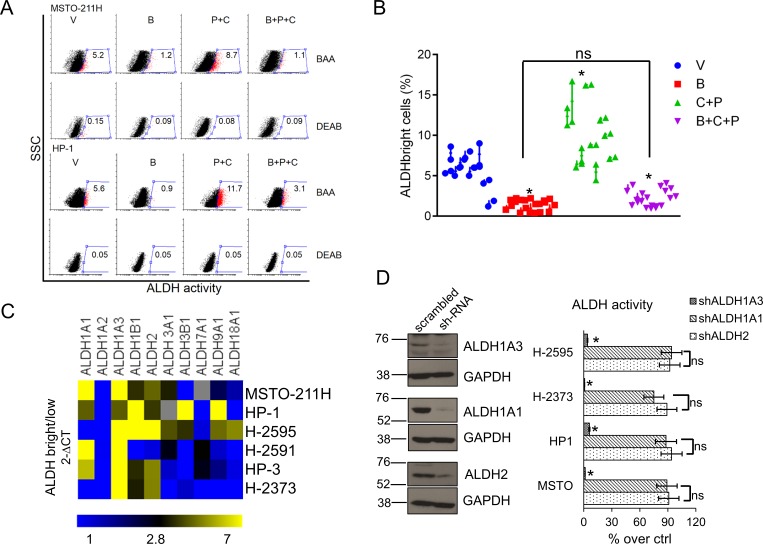
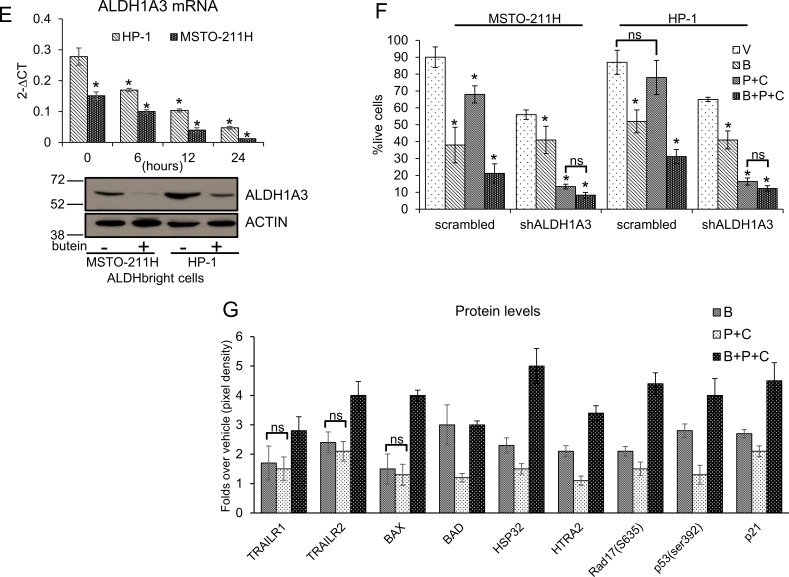
Figure 1. Butein affects the survival of MPM chemoresistant cell subpopulations (ALDHbright cells).
A. Butein reduces the number of ALDHbright cells in MPM cultures. Representative flow cytometry plots showing the percentage of ALDHbright cells (red, gated) in MPM cell cultures treated for 24hrs with vehicle (V: DMSO 0.05%) and butein (B: 18μM), alone or in combination with pemetrexed + cisplatin (P+C: 10 μM + 5 μM, respectively) and stained for ALDH activity at 96hrs. The percentage of ALDHbright cells was determined over the same cells treated with a specific ALDH inhibitor (DEAB) immediately after adding the ALDH substrate (BAA). B. Graph showing the average ALDHbright cell number from the grouped MPM cell lines (n=10) treated as indicated in 1A. C-D. The ALDH1A3 is responsible for the aldehyde dehydrogenase (ALDH) activity of the ALDHbright cells. C. Heat map: mRNA levels of the detectable ALDH isoforms in purified ALDHbright and ALDHlow cells from 6 MPM cell lines. D. Left. Representative western blotting of MSTO-211H cells infected with a pool of ALDH1A1, ALDH2 and ALDH1A3 targeting shRNAs and control (scrambled) shRNAs, selected with puromycin and stained as indicated. Right. ALDH activity in 4 representative MPM cell lines infected as indicated in the left panel. Percentage of ALDH activity is relative to cells infected with the scrambled shRNA (control). Duplicate experiments. E. Butein modulates the expression of ALDH1A3. Upper. ALDH1A3 mRNA levels of purified MSTO-211H and HP-1 ALDHbright cells treated with butein for the indicated times, as assessed by quantitative PCR. Lower. Western Blotting with anti-ALDH1A3 specific antibodies and anti-actin (as a loading control) of whole cell lysates from purified MSTO-211H and HP-1 ALDHbright cells treated with butein for 36hrs F-G. Butein treatment affects the viability of purified ALDHbright cells. Percentage of SYTOX red negative cells from MSTO-211H and HP-1 ALDHbright cells infected with a vector expressing scrambled shRNA or ALDH1A3-shRNAs, respectively) and treated as indicated for 24hrs and harvested at 72hrs. G. Protein levels of stress response genes and apoptotic effectors in the indicated MPM cell lines treated as in fig. 1F and harvested at 48hrs. Duplicate experiments. Histogram bars represent the mean ± s.e.m of ≥ three experiments, except were indicated otherwise. Statistics: * p < 0.05; ns=not significant: (p > 0.05). One-way analysis of variance with Tukey's post hoc corrections-comparing the mean of each group with the mean of every other group (B) or Student's t-test (comparing each sample to its control or, when indicated, to other samples within the same group) (D, E. F. G).


