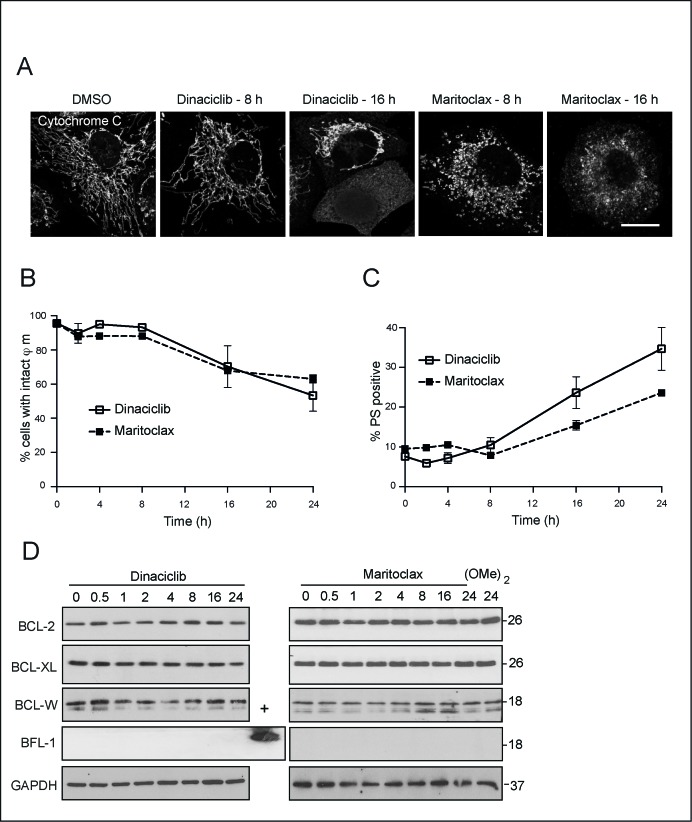
Figure 3. Dinaciclib and maritoclax exert their effects upstream of cytochrome c release and loss in mitochondrial membrane potential.
(A) H460 cells, grown on coverslips, were exposed for 8 or 16 h to dinaciclib (30 nM) or maritoclax (3 μM), stained with the indicated primary and secondary antibodies and subjected to confocal microscopy. Scale bar – 10 μm. (B and C) H460 cells exposed to dinaciclib (30 nM) or maritoclax (3 μM) for the indicated times were stained with (B) TMRE to monitor changes in mitochondrial membrane potential (φm) or (C) Annexin V-FITC to assess cell death by measuring PS externalization. Error bars represent the Mean ± SEM from three independent experiments. (D) Whole cell lysates from H460 cells, exposed to dinaciclib (30 nM), maritoclax (3 μM) or dimethoxymaritoclax (3 μM) for the indicated times, were immunoblotted with the indicated antibodies. Recombinant BFL-1 protein was used as a positive control for the BFL-1 blot.

