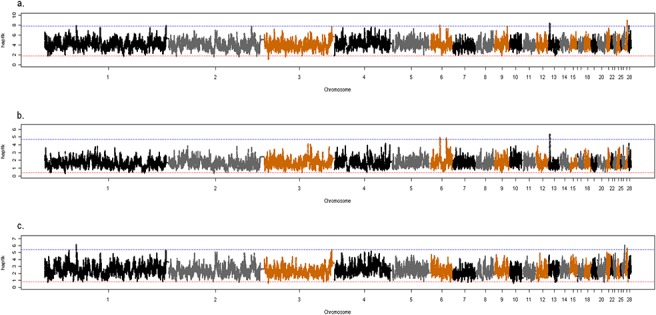
Fig 3. Manhattan plot of hapFLK analysis over the entire genome with 5 clusters.

Blue (red) line indicates the upper (lower) 0.05% of hapFLK distribution, for, (A) within all breeds, (B) within white breeds, and, (C) Within brown breeds.

Blue (red) line indicates the upper (lower) 0.05% of hapFLK distribution, for, (A) within all breeds, (B) within white breeds, and, (C) Within brown breeds.