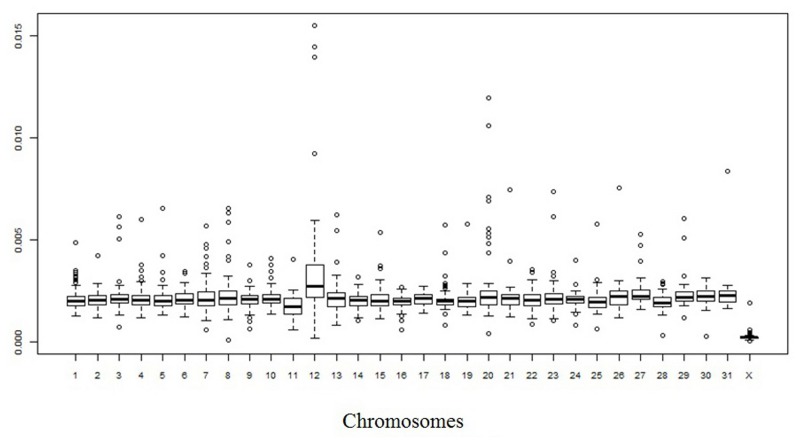
Fig 7. Densities of donkey single nucleotide polymorphisms: Box plot of the distribution by chromosomes of the SNP density in 1-Mb windows.
Quartiles are the edges of the box. The edges of the boxes correspond to quartiles; the notches are the standard errors of the median; and the vertical bars to the range.

