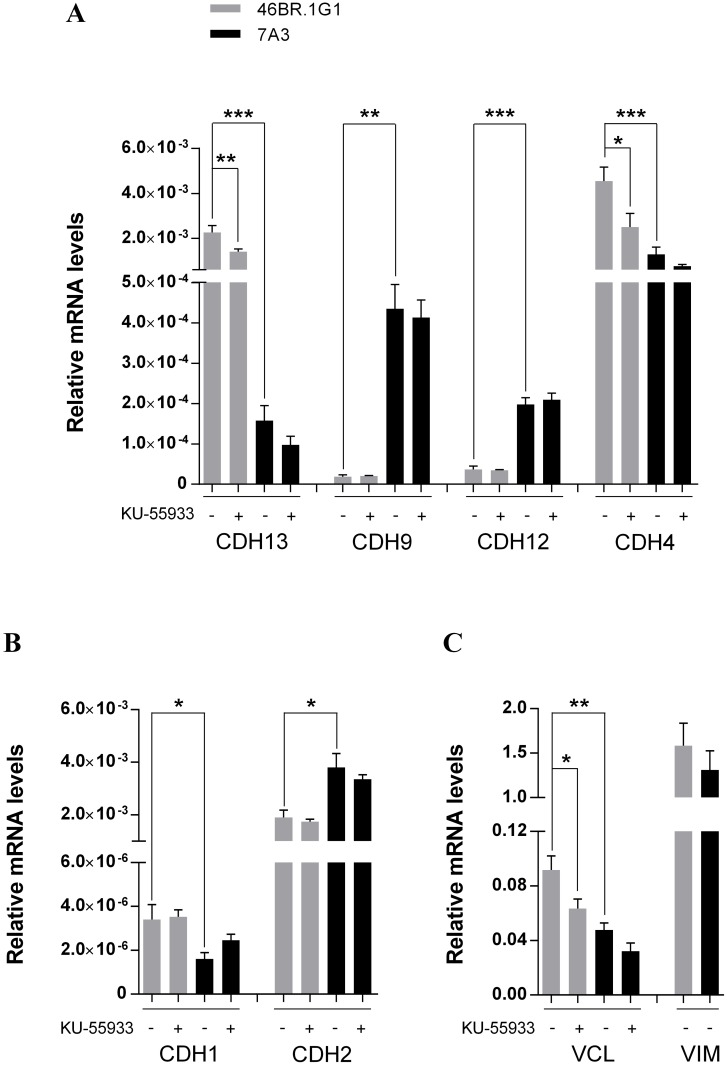
Fig 4. Analysis of vinculin, vimentin and cadherins gene expression by real time RT-PCR.
The panels show the relative expression levels of the indicated transcripts in 46BR.lG1 (gray bars) and 7A3 cells (black bars) before (-) and after (+) incubation with 10 μM KU-55933. Gene transcripts have been internally normalized versus RPLP0 expression levels. Data are shown as mean ± SEM of four independent experiments. CDH: cadherin, VCL: vinculin, VIM: vimentin. * P < 0 .05, ** P < 0.01, *** P < 0.001.

