
Table 2.
Summary statistics for Years 4 and 5
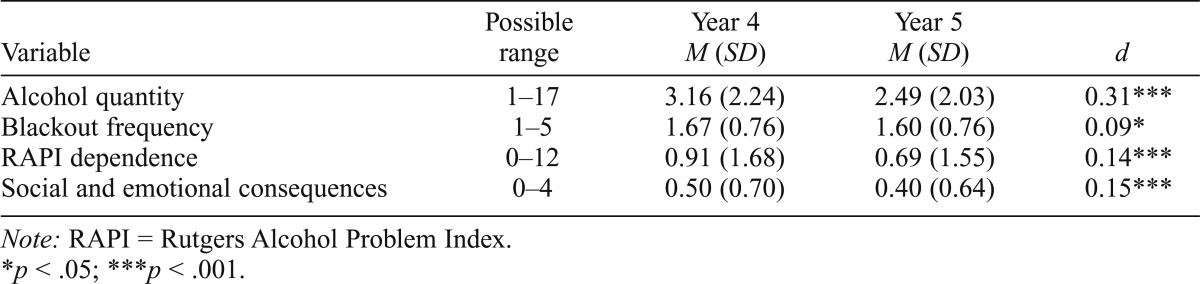
| Variable | Possible range | Year 4 M (SD) | Year 5 M (SD) | d |
| Alcohol quantity | 1−17 | 3.16 (2.24) | 2.49 (2.03) | 0.31*** |
| Blackout frequency | 1−5 | 1.67 (0.76) | 1.60 (0.76) | 0.09* |
| RAPI dependence | 0−12 | 0.91 (1.68) | 0.69 (1.55) | 0.14*** |
| Social and emotional consequences | 0−4 | 0.50 (0.70) | 0.40 (0.64) | 0.15*** |
Note: RAPI = Rutgers Alcohol Problem Index.
*
p < .05;
***
p < .001.