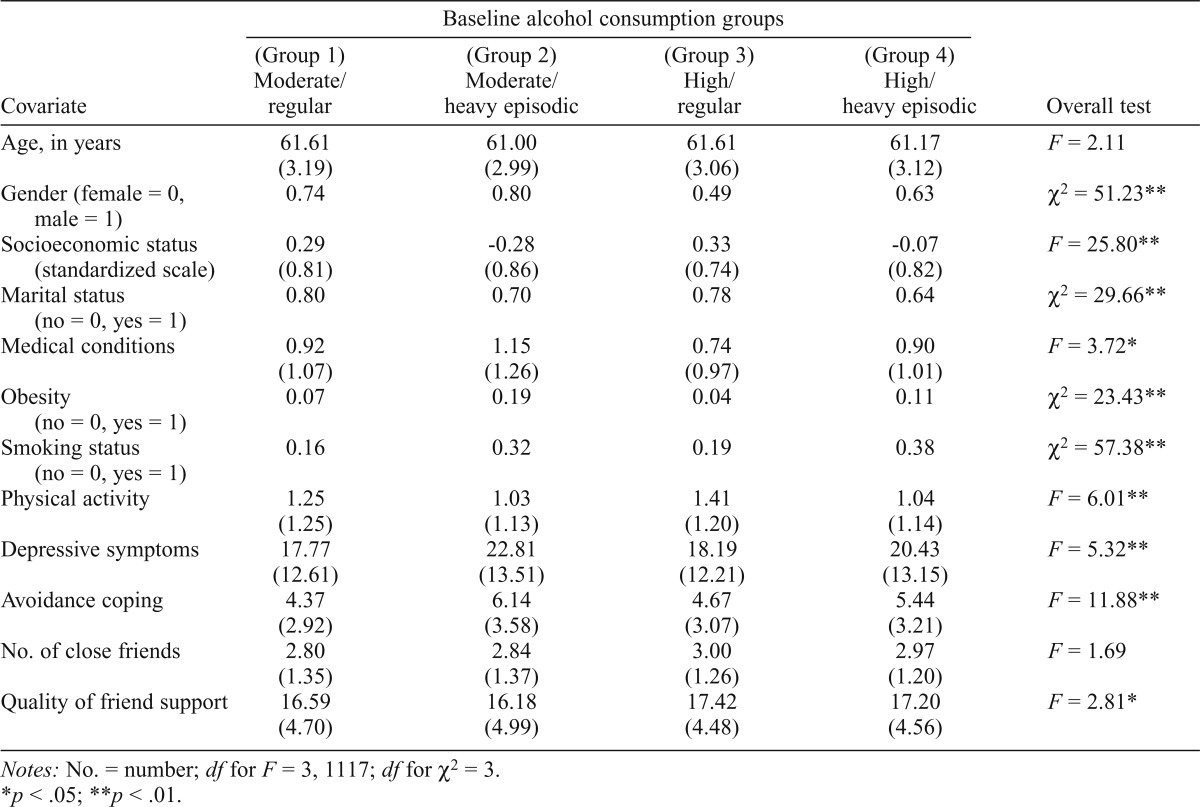
Table 2.
Means and standard deviations (in parentheses) for baseline covariates by baseline alcohol consumption group membership. For continuous variables, standard deviations are shown in parentheses. Results of overall F and chi-square tests are shown in the last column (N = 1,121).

| Covariate | Baseline alcohol consumption groups |
Overall test | |||
| (Group 1) Moderate/regular | (Group 2) Moderate/heavy episodic | (Group 3) High/regular | (Group 4) High/heavy episodic | ||
| Age, in years | 61.61 (3.19) | 61.00 (2.99) | 61.61 (3.06) | 61.17 (3.12) | F = 2.11 |
| Gender (female = 0, male = 1) | 0.74 | 0.80 | 0.49 | 0.63 | χ2 = 51.23** |
| Socioeconomic status (standardized scale) | 0.29 (0.81) | -0.28 (0.86) | 0.33 (0.74) | -0.07 (0.82) | F = 25.80** |
| Marital status (no = 0, yes = 1) | 0.80 | 0.70 | 0.78 | 0.64 | χ2 = 29.66** |
| Medical conditions | 0.92 (1.07) | 1.15 (1.26) | 0.74 (0.97) | 0.90 (1.01) | F = 3.72* |
| Obesity (no = 0, yes = 1) | 0.07 | 0.19 | 0.04 | 0.11 | χ2 = 23.43** |
| Smoking status (no = 0, yes = 1) | 0.16 | 0.32 | 0.19 | 0.38 | χ2 = 57.38** |
| Physical activity | 1.25 (1.25) | 1.03 (1.13) | 1.41 (1.20) | 1.04 (1.14) | F = 6.01** |
| Depressive symptoms | 17.77 (12.61) | 22.81 (13.51) | 18.19 (12.21) | 20.43 (13.15) | F = 5.32** |
| Avoidance coping | 4.37 (2.92) | 6.14 (3.58) | 4.67 (3.07) | 5.44 (3.21) | F = 11.88** |
| No. of close friends | 2.80 (1.35) | 2.84 (1.37) | 3.00 (1.26) | 2.97 (1.20) | F = 1.69 |
| Quality of friend support | 16.59 (4.70) | 16.18 (4.99) | 17.42 (4.48) | 17.20 (4.56) | F = 2.81* |
Notes: No. = number; df for F = 3, 1117; df for χ2 = 3.
p < .05;
p < .01.
