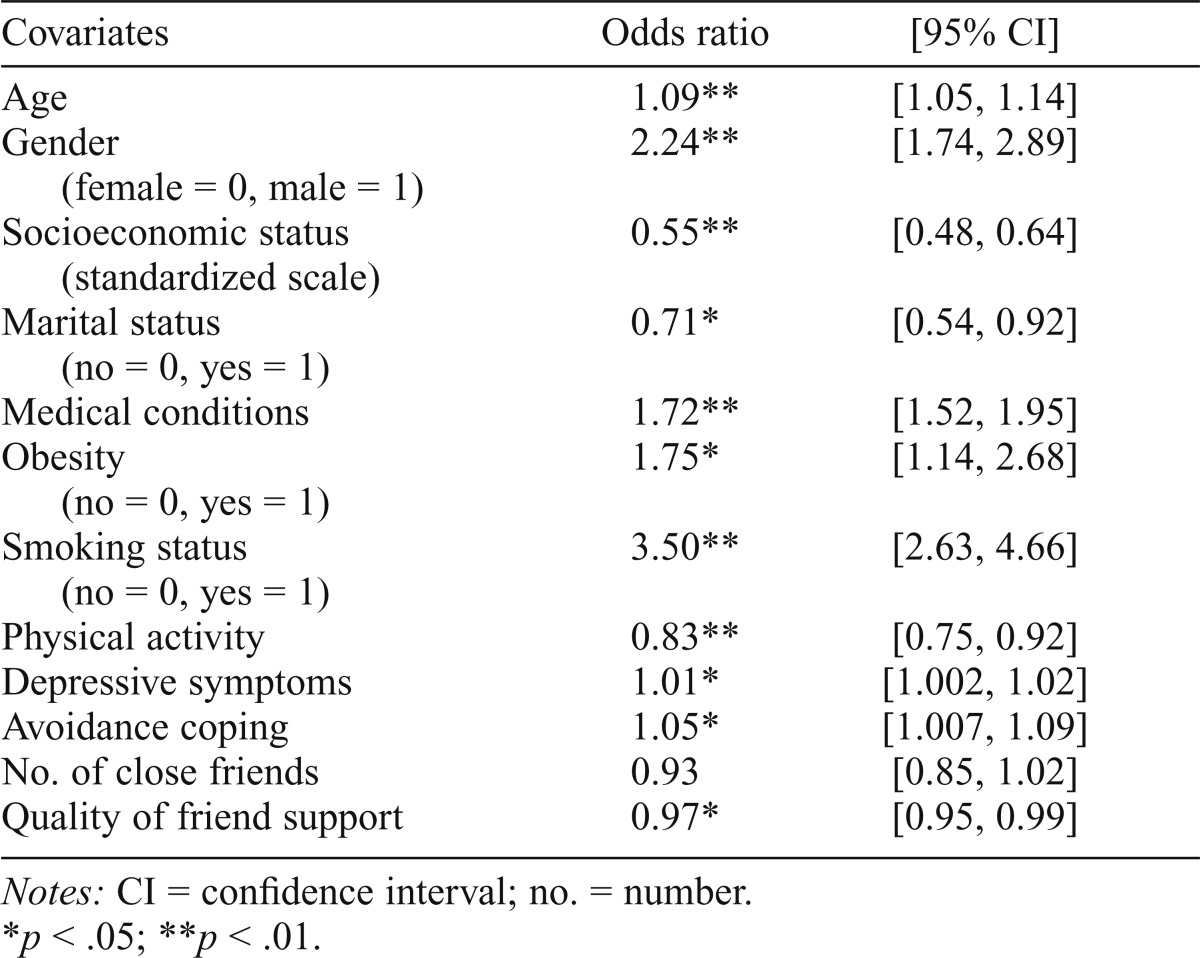
Table 3.
Results of multiple logistic regression analyses with each baseline covariate as a predictor of 20-year total mortality (N = 1,121)

| Covariates | Odds ratio | [95% CI] |
| Age | 1.09** | [1.05, 1.14] |
| Gender (female = 0, male = 1) | 2.24** | [1.74, 2.89] |
| Socioeconomic status (standardized scale) | 0.55** | [0.48, 0.64] |
| Marital status (no = 0, yes = 1) | 0.71* | [0.54, 0.92] |
| Medical conditions | 1.72** | [1.52, 1.95] |
| Obesity (no = 0, yes = 1) | 1.75* | [1.14, 2.68] |
| Smoking status (no = 0, yes = 1) | 3.50** | [2.63, 4.66] |
| Physical activity | 0.83** | [0.75, 0.92] |
| Depressive symptoms | 1.01* | [1.002, 1.02] |
| Avoidance coping | 1.05* | [1.007, 1.09] |
| No. of close friends | 0.93 | [0.85, 1.02] |
| Quality of friend support | 0.97* | [0.95, 0.99] |
Notes: CI = confidence interval; no. = number.
p < .05;
p < .01.
