Fig. 4.

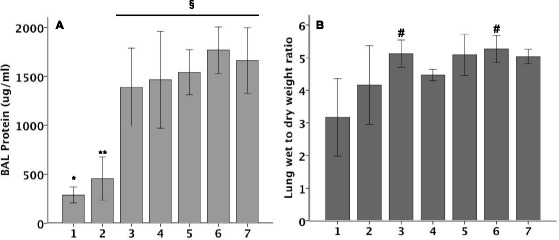
BAL protein (Panel a) and wet to dry lung weight ratio (Panel b) over time on mice treated with IT Bleomycin. N = 5-6 per group. *p = 0.006, **p = 0.017, §p < 0.001, #p < 0.05 versus PBS treatment by t test

BAL protein (Panel a) and wet to dry lung weight ratio (Panel b) over time on mice treated with IT Bleomycin. N = 5-6 per group. *p = 0.006, **p = 0.017, §p < 0.001, #p < 0.05 versus PBS treatment by t test