Figure 2.
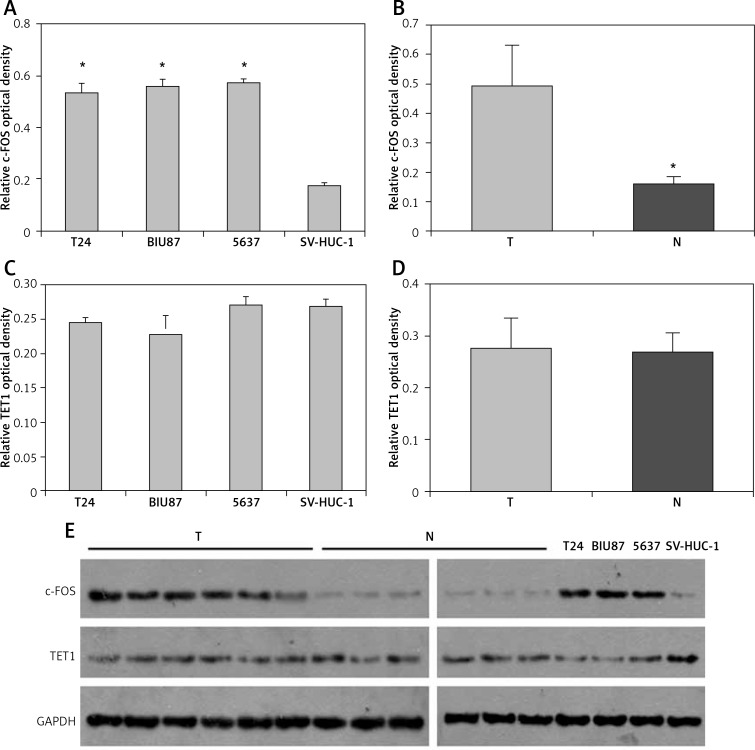
Relative expression levels of c-FOS and TET1 in bladder cancer tissues and bladder cancer cell lines. Quantitative results of western blotting are shown in Figures 2 A–D and representative western blotting results are shown in Figure 2 E. A – Mean level of c-FOS expression in three bladder cancer cell lines and SV-HUC-1 cells. One-way LSD test, *p < 0.01. B – Mean level of c-FOS expression in six bladder cancer specimens and paired adjacent non-tumor tissues. Student's t-test, *p < 0.01. C – TET1 expression levels in three bladder cancer cell lines and SV-HUC-1 cell line (p > 0.05). D – TET1 expression levels in six bladder cancer tissues and adjacent non-tumor tissues (p > 0.05). E – Relative levels of c-FOS and TET1 were examined by western blotting. GAPDH was used as an internal control
T – Tumor tissues, N – adjacent non-tumor tissues.

