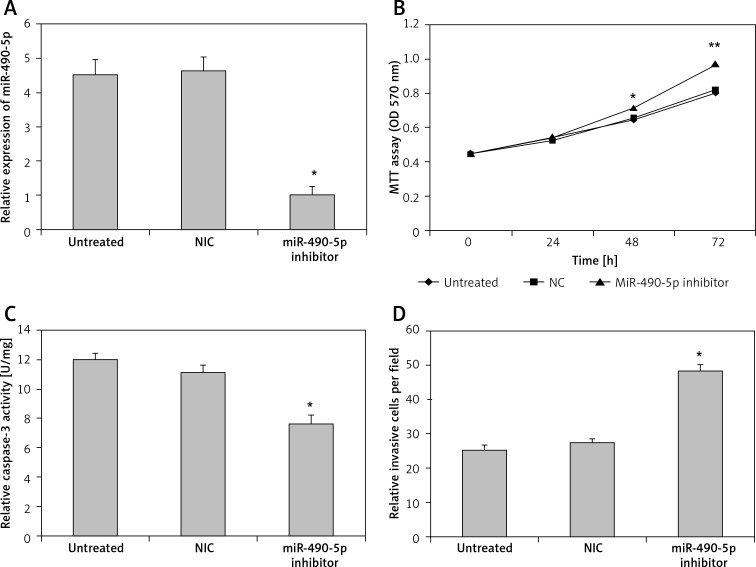
Figure 4.
Effects of miR-490-5p suppression on cell proliferation, apoptosis and invasion activity in T24 cell line in vitro. A – Expression level of miR-490-5p in the untreated group, the negative control miRNA group and the miR-490-5p inhibitor group (*p < 0.01). B – Cell viability assayed by MTT assay at 0 h, 24 h, 48 h and 72 h after transfection (*p < 0.05 at 48 h; ** p < 0.01 at 72 h). C – Caspase-3 level in T24 cells after miR-490-5p suppression (*p < 0.01). D – Cell invasion ability after miR-490-5p suppression in T24 cells (*p < 0.01)

