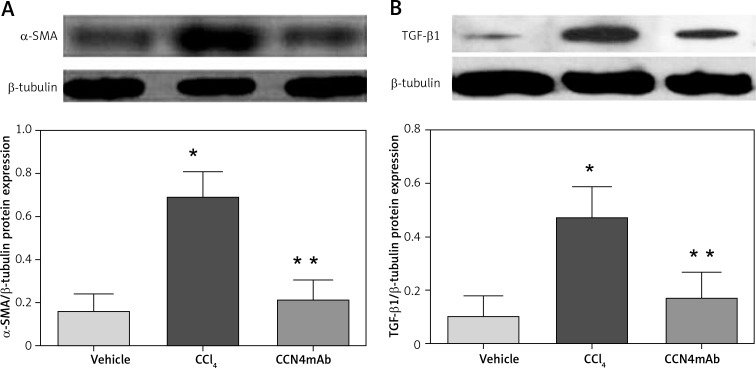
Figure 6.
Protein expression levels of pro-fibrotic factors (A) α-SMA and (B) TGF-β1. Chronic CCl4 treatment up-regulated the protein expression of α-SMA and TGF-β1 (*p < 0.001). The protein expression levels were expressed as the ratio of band intensity for target protein relative to that for internal control (β-tubulin), n = 12 mice per group.
*P < 0.01, compared with vehicle-treated normal control; **p < 0.01 compared with CCl4-treated group

