Figure 1.

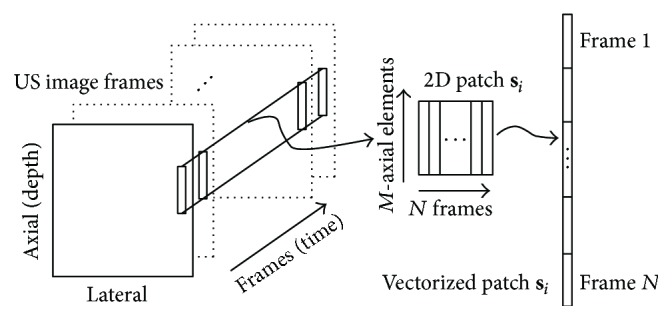
Illustration of how a patch s i is extracted from a sequence of several frames of complex echo data. The small rectangles in the ultrasound image frames represent M-axial elements in each frame which are concatenated to form the patch s i.

Illustration of how a patch s i is extracted from a sequence of several frames of complex echo data. The small rectangles in the ultrasound image frames represent M-axial elements in each frame which are concatenated to form the patch s i.