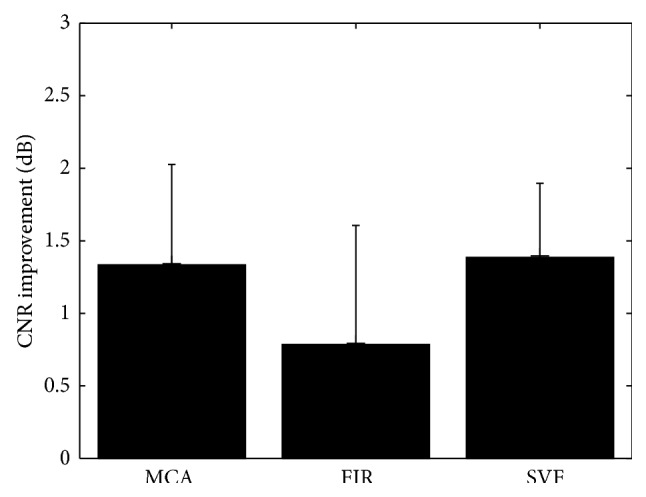
Figure 13.

Mean improvement CNR comparison for MCA, SVF, and FIR clutter reduction methods over the unfiltered echo data. Error bars represent standard deviation over eight datasets.

Mean improvement CNR comparison for MCA, SVF, and FIR clutter reduction methods over the unfiltered echo data. Error bars represent standard deviation over eight datasets.