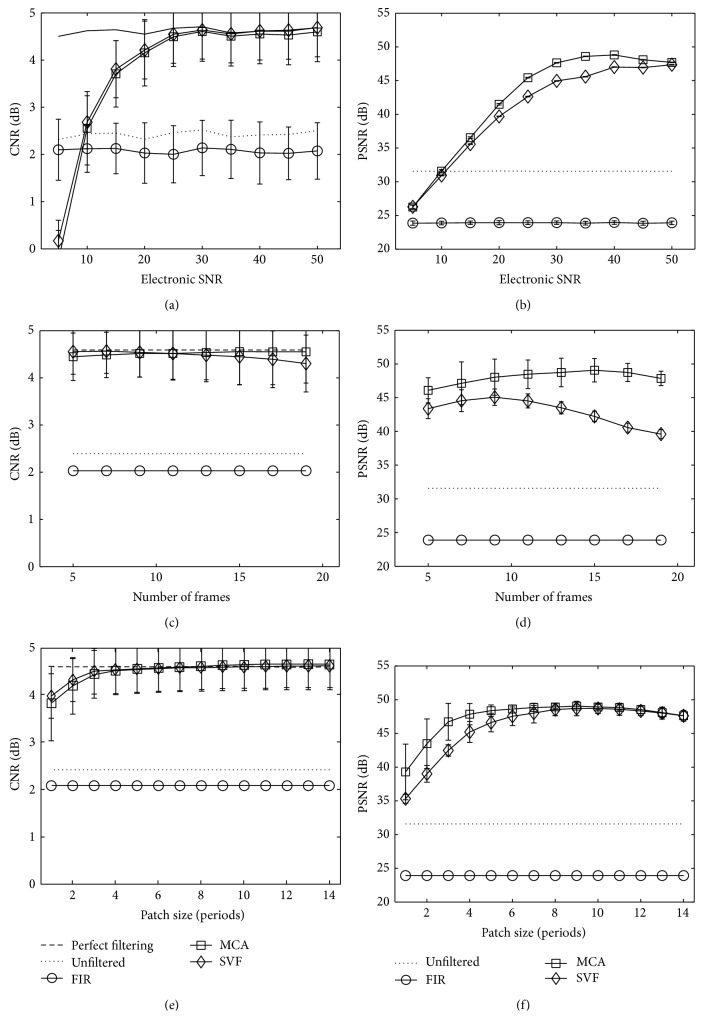
Figure 9.
Mean CNR measurements for MCA, SVF, and FIR methods for varied (a) electronic SNR, (b) patch size in temporal dimension, and (c) patch size in axial dimension. Markers represent mean CNR and error bars the standard deviation over 100 simulations. The dashed line, labeled “perfect filtering,” represents the mean CNR when the clutter artifacts are not present in the simulated echo data. Likewise, “unfiltered” represents the CNR or PSNR of the measured data with clutter artifacts and when no filtering technique is applied.

