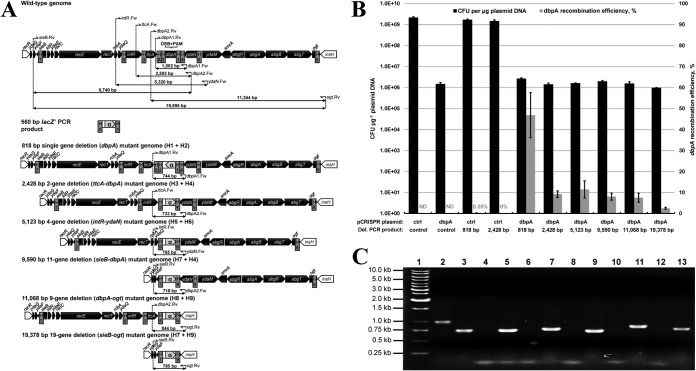
FIG 3.
Challenging the proposed strategy of dsDNA gene replacement by varying chromosomal gene deletion size. (A) Replacement of various-size chromosomal regions with a recombinogenic PCR product encoding lacZ′ (α). PCR primers possessing different Hn homology regions corresponding to chromosomal deletions of various sizes (818 to 19,378 bp) were used to amplify a 560-bp lacZ′ product from pUC19. In each case, successful gene replacement replaces the dbpA PAM sequence and averts generation of a chromosomal DSB, which are both located between each set of homology regions. Genomic layout between the essential racR and insH genes (white) is shown for each gene replacement mutant. Chromosomal gene orientation is shown based on the dbpA coding sequence in the reverse (antisense) orientation. Primer binding sites and expected PCR product sizes are also depicted for each gene replacement mutant, in addition to the wild-type strain. All chromosomal genes and the lacZ′ PCR product are depicted to scale. (B) Electroporation and dbpA recombination efficiency data resulting from electroporation (pCRISPR::ctrl plus control PCR product), CRISPR/Cas9 (pCRISPR::dbpA plus control PCR product), and recombineering (pCRISPR::ctrl plus 818-bp or 2,428-bp PCR deletion cassette) controls, as well as six various-size chromosomal deletions using CRISPR/Cas9-coupled recombineering (pCRISPR::dbpA plus PCR deletion cassette). Electroporation efficiency is defined as the total number of CFU generated per microgram of plasmid DNA (pCRISPR::ctrl or pCRISPR::dbpA), and dbpA recombination efficiency was measured by determining the proportion of blue colonies. A recombination efficiency of 0% reflects an inability to identify blue mutant colonies on agar plates containing up to 400 transformants. Recombination efficiency at the dbpA locus was not determined (ND) for electroporation of the nonrecombinogenic control PCR product. Results shown are averages of at least two independent experiments, and error bars depict standard deviation. (C) Colony PCR screening of gene replacement mutants. Various PCR primers were used to ensure successful genomic organization by screening one white colony and one blue colony resulting from each gene replacement scheme. Lane 1, marker; lanes 2 and 3, 818-bp gene replacement colonies; lanes 4 and 5, 2,428-bp gene replacement colonies; lanes 6 and 7, 5,123-bp gene replacement colonies; lanes 8 and 9, 9,590-bp gene replacement colonies; lanes 10 and 11, 11,068-bp gene replacement colonies; lanes 12 and 13, 19,378-bp gene replacement colonies; lanes 2, 4, 6, 8, 10, and 12, white (negative) colonies; lanes 3, 5, 7, 9, 11, and 13, blue (positive) colonies. White colonies corresponding to lanes 4, 6, 8, 10, and 12 are expected to generate a PCR product that is too large to be amplified under the conditions employed.

