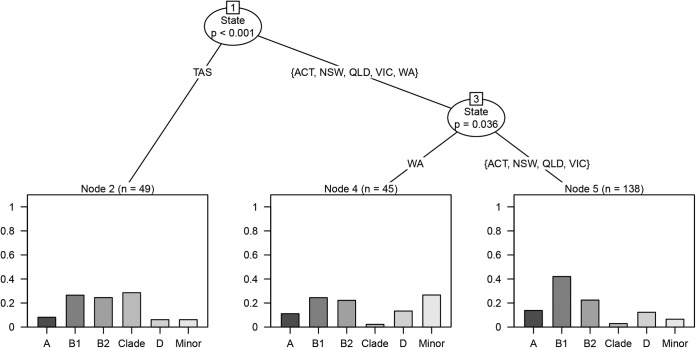
FIG 3.
Regression tree of how the distribution of the different phylogenetic groups differed between the Australian states or territory within the in-care human association category. The y axes represent proportion of isolates. TAS, Tasmania; ACT, Australian Capital Territory; NSW, New South Wales; QLD, Queensland; VIC, Victoria; WA, Western Australia.

