
FIG 2.
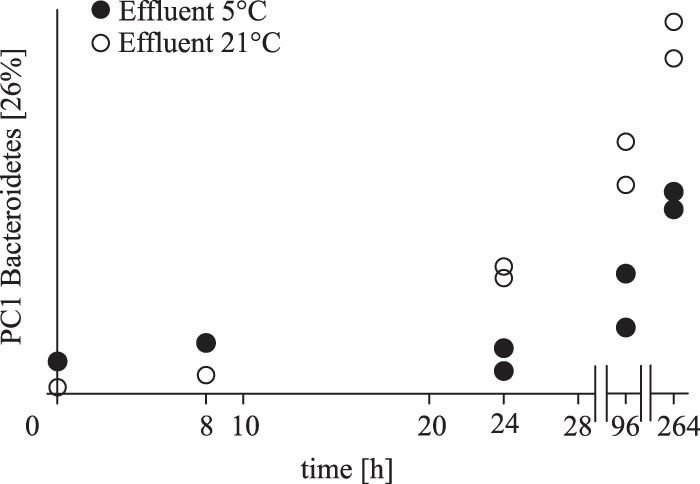
16S rRNA gene-based qualitative UniFrac community structure dynamics in the microcosm experiments with WWTP 2 effluent. The first principal coordinate (PC1) versus time is shown for the phylum Bacteroidetes (26% of the total variance is explained by PC1) on the x and y axes, respectively. Black and open dots represent microcosm experiments at 5 and 21°C, respectively. Analyses at the 0- and 8-h time points are shown as a single analysis, whereas analyses at the 24-, 96-, and 264-h time points are shown as duplicate analyses.