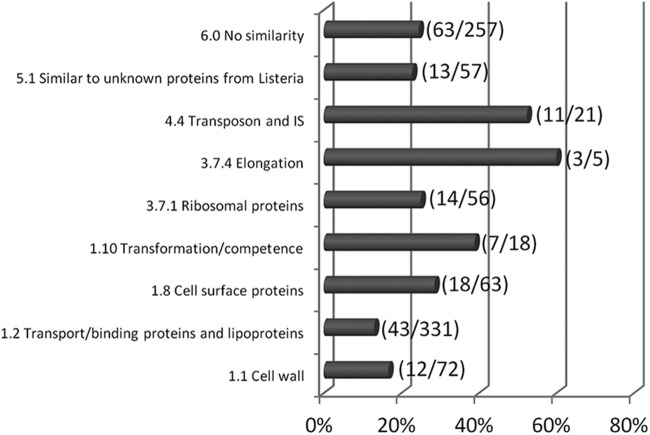
FIG 5.
Functional categories identified to be significant by gene ontology and the percentage of genes from the set of genes with lower transcript levels in the ΔagrA mutant than in parental strain L. monocytogenes L9 under biotic conditions. The values in parentheses represent the number of genes with significant variations in transcript levels/the total number of genes in the functional category. IS, insertion sequence.

