
FIG 3.
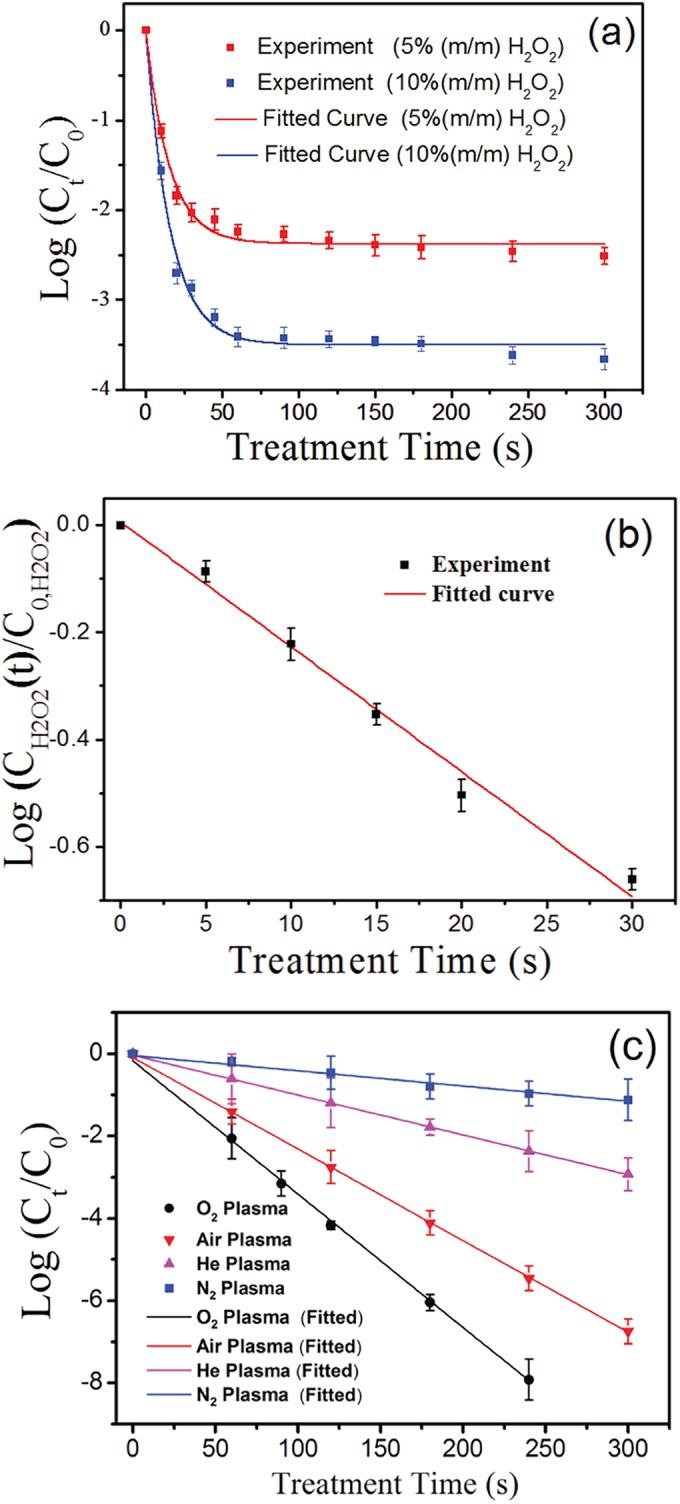
(a) Comparison between the log(Ct/C0) values obtained in 5% and 10% H2O2 solutions within different treatment times and fitted theoretically using equation 6. m/m, mass fraction. (b) Comparison between the log[CH2O2(t)/C0,H2O2] values obtained in the 5% H2O2 solution with different treatment times and fitted theoretically using equation 3. (c) Comparison between log(Ct/C0) values obtained under He, N2, air, and O2 plasma treatments and fitted theoretically using equation 9. The data points and error bars represent, respectively, the averages and standard deviations from four independent measurements.