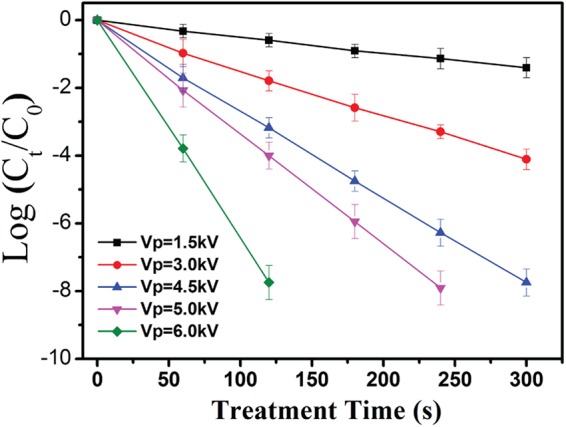
FIG 4.

Comparison between log(Ct/C0) values measured experimentally at different VP values and fitted theoretically using equation 9. The data points and error bars represent, respectively, the averages and standard deviations from four independent measurements.
