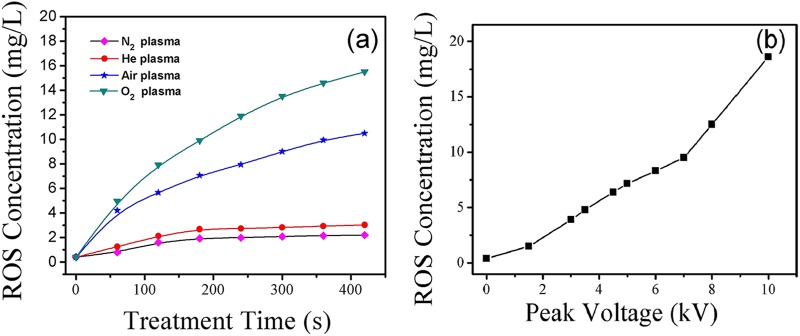
FIG 7.

(a) ROS concentrations in N2, He, air, and O2 plasma-treated solutions as a function of plasma treatment time. The atmospheric-pressure microplasmas were generated at a VP of 4.5 kV. (b) ROS concentrations in the O2 plasma-treated solution as a function of VP. The plasma treatment time remained constant at 100 s.
