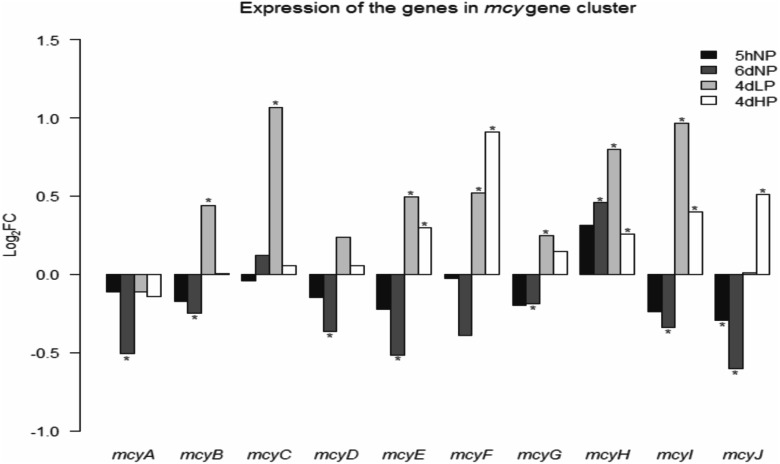
FIG 3.
Expression of the genes in the microcystin gene cluster. Most of the genes were upregulated under prolonged phosphorus stress, giving a hint that regulation of microcystin production happens on some level other than the transcriptomic level. The asterisks indicate significant changes in the transcription level compared with the control condition (P ≤ 0.05).

