Figure 3.
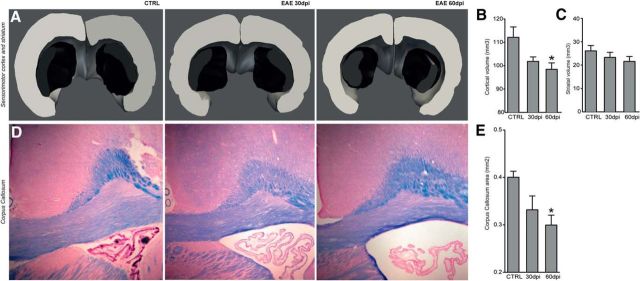
Atrophy of GM and WM. A, Representative 3D reconstructions of the sensorimotor cortex (gray volumes) and striatum (black volumes) of a CTRL rat, a rat with EAE at 30 dpi, and a rat with EAE at 60 dpi obtained from the serial tissue sections analyzed for stereology. B, C, Quantification of the cortical and striatal volumes. Note the progressive atrophy of the cortical tissue volume, which reaches statistical significance in EAE at 60 dpi. A trend toward reduction of the striatal volume over time is also observed. Data are expressed as mean ± SEM from four rats per group. D, Representative microphotographs of Luxol fast blue-stained brain sections depicting the CC of a CTRL rat, a rat with EAE at 30 dpi, and a rat with EAE at 60 dpi. Note the progressive enlargement of the lateral ventricle suggestive of global brain atrophy associated with EAE over time. Scale bars, 100 μm. E, Quantification of the CC area showing significant atrophy at 60 dpi versus CTRL. *p ≤ 0.05.

