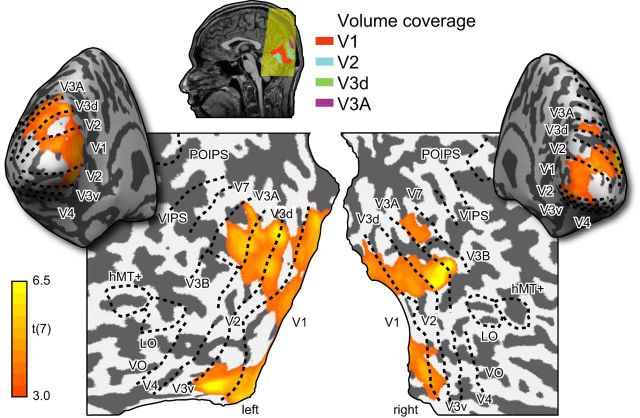
Figure 2.
Illustrations of the cortical surface with superimposed locations of the ROIs. Sulci are depicted in darker gray than the gyri. Shown on the maps are retinotopic areas, V3B/KO, the human motion complex (hMT+/ V5), and LO area. The activation map shows the results of a random-effects analysis of a searchlight classifier that discriminated between different slanted stimuli. The color code represents the t value of the classification accuracies obtained by moving a spherical aperture throughout the measured volume. This confirmed that our ROIs covered the likely loci of areas encoding stimulus information.

