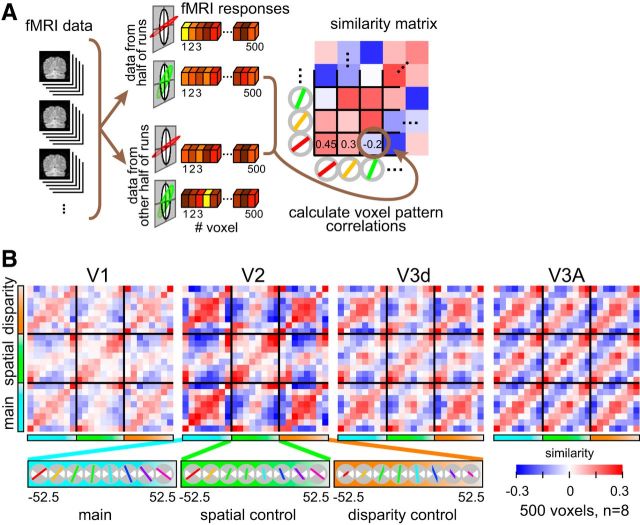
Figure 3.
Illustration of the cross-correlation approach and empirical data. A, A schematic of the data treatment. The fMRI data were split in halves and the vector of voxel responses was then correlated across stimulus conditions. We used a cross-validation procedure, averaging together the results of different splits of the empirical data. The resulting cross-correlation matrix (averaged over cross-validations) is represented using a blue-to-red color code. B, Empirical cross-correlation matrices from areas V1, V2, V3d, and V3A. Slant angle varies in an ordered fashion for the three experimental conditions (main, spatial control, disparity control). The mean regression coefficient across split-halves is represented by the color saturation of each cell in the matrix.

