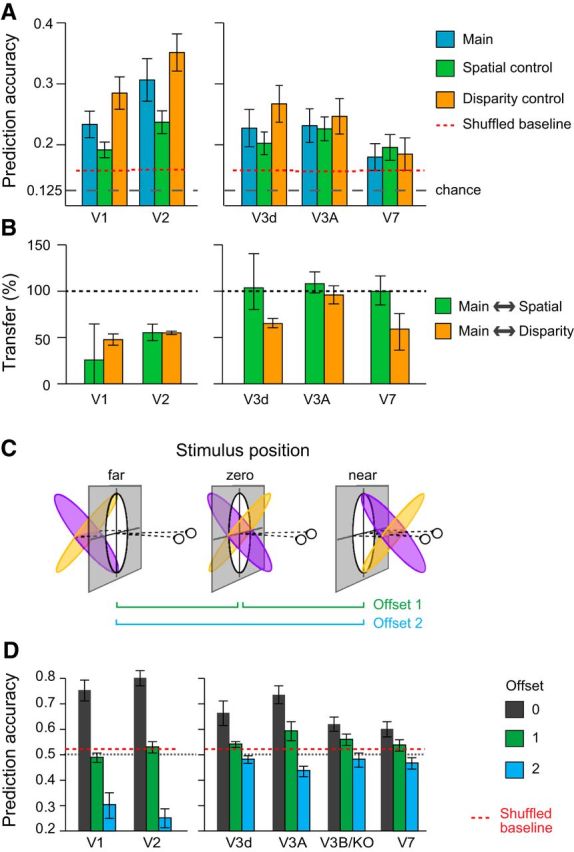
Figure 8.

Results of MVPA decoding of surface slant. A, Eight-way classification results across ROIs with above chance prediction accuracy for the three conditions. Error bars show ±SEM. The dotted horizontal line represents the upper 97.5th centile of randomly permuted data. B, Transfer results expressed as a percentage of the within condition prediction accuracy. One-hundred percent would indicate the same accuracy for testing and training between conditions as for testing on the same condition. Error bars show SEM. C, Manipulating the depth positions of the slanted surfaces. Opposing slants were presented centered on the fixation point (zero), or translated away (far) or toward (near) the observer. D, Prediction accuracies for the binary classification of opposing slants. The dashed red line represents the upper 97.5th centile based on randomly permuted data. Error bars show ±SEM.
