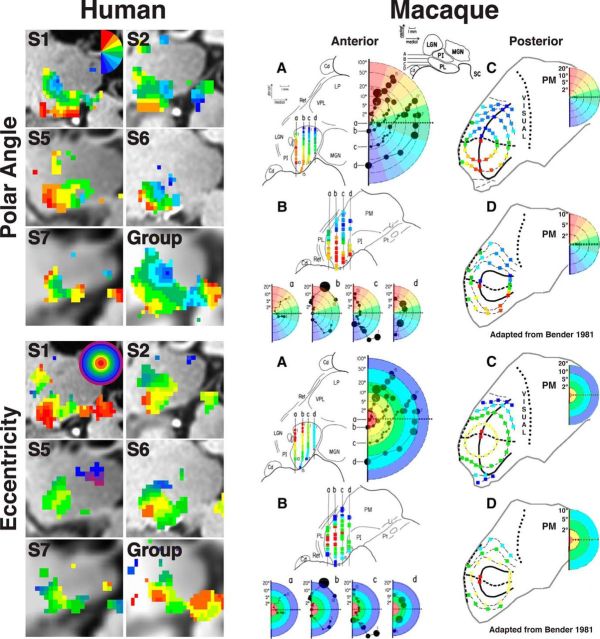
Figure 12.
Comparison of the topographic organization within the ventral pulvinar between humans and macaques. Comparison of fMRI-defined polar angle (top half) and eccentricity (bottom half) representations within the human ventral pulvinar (left side) with electrophysiologically defined topographic organization of the macaque pulvinar (right side). Adapted from Bender (1981). The macaque coronal images show visual field coverage from electrode penetrations spanning anterior (A) to posterior (D) slices of the pulvinar. See axial slice inset for relative anterior/posterior positions of each coronal slice. Coronal images A and B illustrate the retinotopic organization of the inferior pulvinar and the anterior half of the lateral pulvinar. Coronal images C and D illustrate the retinotopic organization of the posterior half of the lateral pulvinar. Color code conventions are the same as Figure 2 and are matched between species.

