
Figure 13.
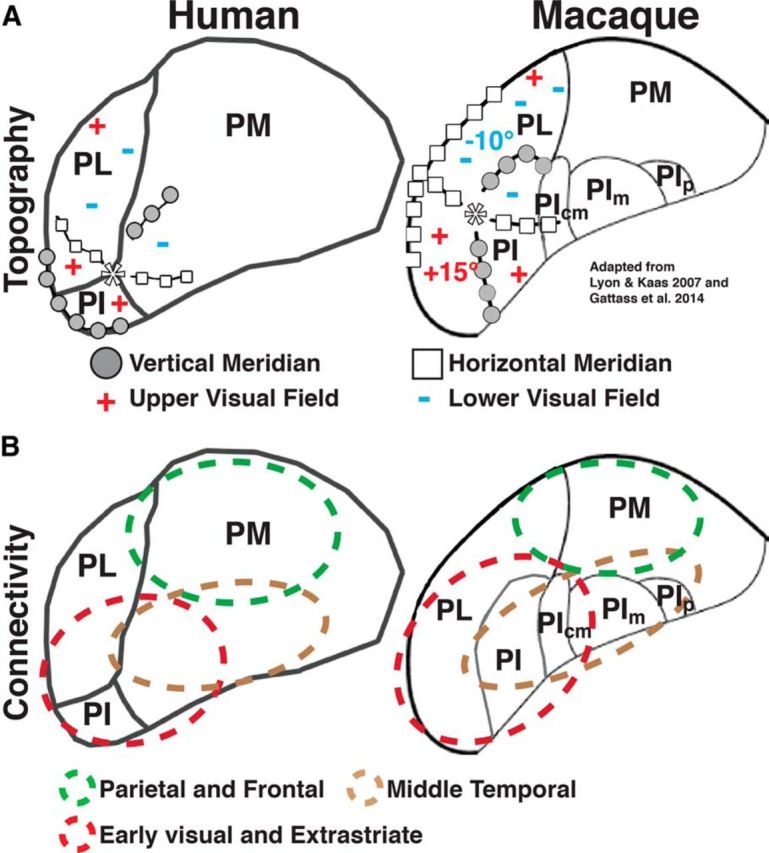
Schematic of the topographic organization and cortical connectivity of the pulvinar between humans and macaque. A, Schematic of the visual field organization in the pulvinar in humans and macaques. Adapted from Kaas and Lyon (2007) and Gattass et al. (2014). Inferior, lateral, and medial subdivisions in the human pulvinar were adapted from Morel et al. (1997). Because of the significant underrepresentation of the vertical meridian in our fMRI data, portions of the border between vPUL1/2 were inferred at points closest to the vertical meridian that corresponded to reversals in phase progression along iso-eccentricity contours. *Mark foveal representations. Shaded circles represent the vertical meridian. White boxes represent the horizontal meridian. +, Upper visual field; −, lower visual field. B, Schematic of regional cortical connectivity patterns in the pulvinar in humans and macaques. Red dashed lines indicate early visual and extrastriate connectivity. Brown dashed lines indicate middle temporal (lateral occipital/temporal in humans) connectivity. Green dashed lines indicate parietal and frontal connectivity. The anterior to posterior gradient of anatomical connections from early visual to ventral temporal cortex is not illustrated in this figure.