
Figure 4.
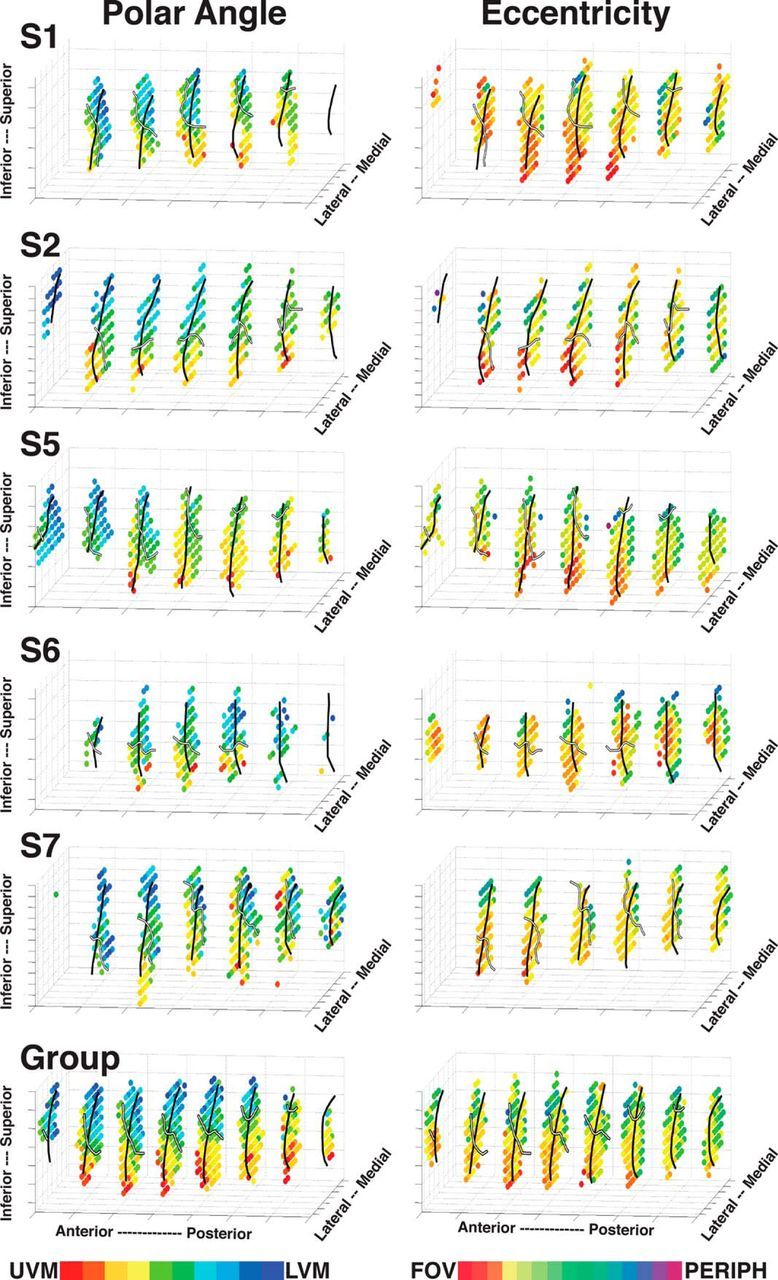
Three-dimensional (3D) plots of visual field representations within the ventral pulvinar. Polar angle (left) and eccentricity (right) phase maps are plotted for Subjects S1, S2, and S5–S7 and a group average (data collapsed across hemispheres). The data are not in a standardized space, and the spatial coordinates are arbitrary. Color code conventions are the same as in Figures 2 and 3, with the exception that ipsilateral representations are color coded black. Black solid line drawn on the individual subject and group average plots indicates the border between vPul1 and vPul2. White solid line indicates the HM.