
Figure 5.
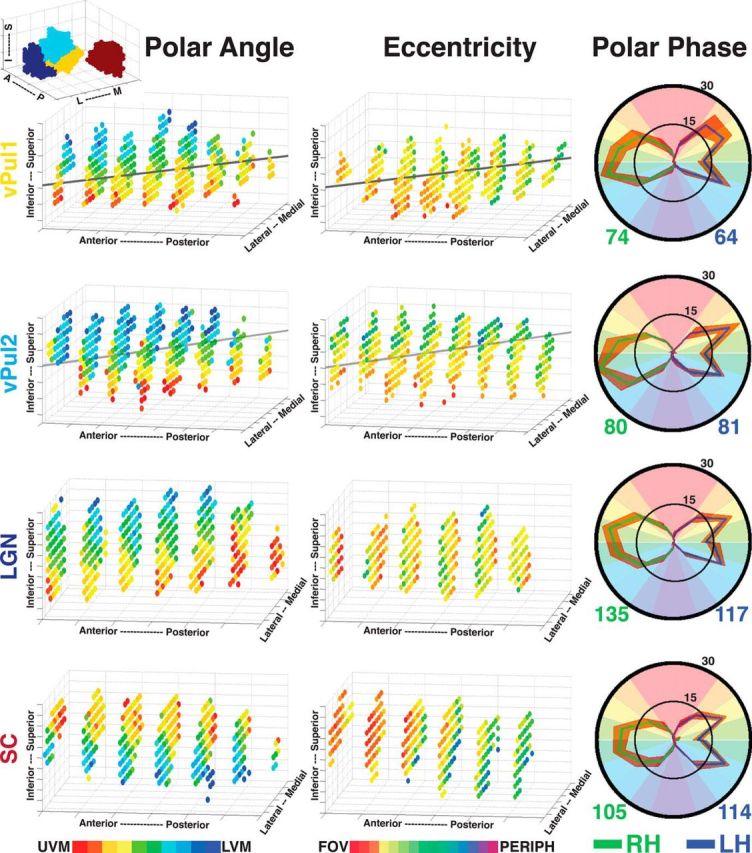
Visual field representations in areas vPul1, vPul2, LGN, and SC. Group average 3D polar angle (left) and eccentricity (middle) maps are plotted for vPul1, vPul2, LGN, and SC. Transparent gray line indicates the AIR for vPul1 and vPul2. Top left 3D plot illustrates the relative locations of the LGN (dark blue), vPul1 (yellow), vPul2 (light blue), and SC (red). Polar phase plots (right) illustrate the distribution of polar angle representations for each subcortical area (thresholded at p < 0.05, uncorrected). The percentage of polar angle coverage (see Materials and Methods) within each area was calculated for subjects individually and then averaged. Solid green and blue lines indicate group averages from right and left hemispheres, respectively. Orange outline indicates the SEM variance. Numbers below each polar plot reflect the average volume in mm3 for each hemisphere.