
Figure 8.
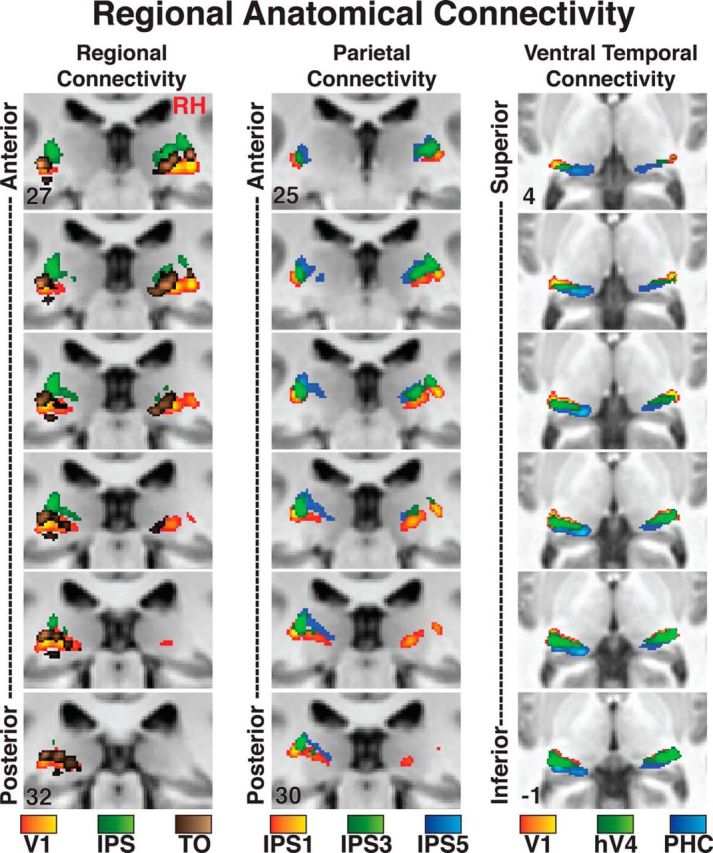
Regional thalamocortical anatomical connectivity of the human pulvinar. Relation of peak connectivity for V1, IPS, and TO in the pulvinar (left column). Relation of peak connectivity for IPS1, IPS3, and IPS5 in the dorsal pulvinar (center). Relation of the peak connectivity for V1, hV4, and PHC in the ventral pulvinar (right column). Coronal images are presented at 1 mm spacing. A standard MNI brain is used as the underlay, and coordinates are inset in the top and bottom images.