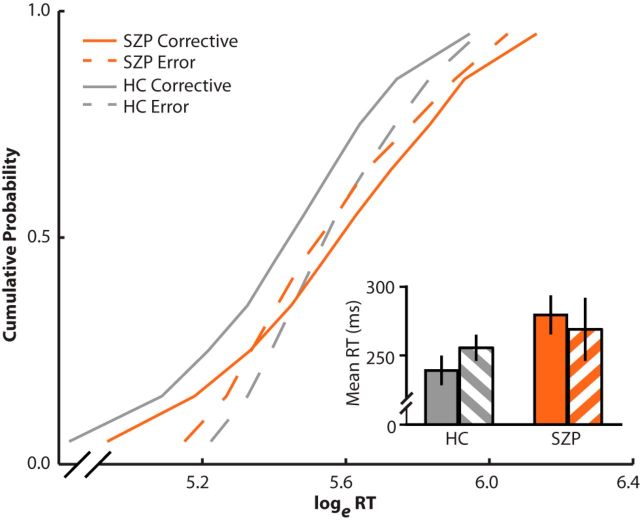
Figure 2.
Error and corrective saccade RTs. RTs were transformed using the natural log (loge). Vincentized reaction time distributions for error (dotted lines) and corrective saccades (solid lines) on double-step trials. HCs are depicted in gray and SZPs are depicted in orange. Error saccades were measured as the time between T1 onset and the onset of the first saccade. Corrective saccades were measured as the time between the onset of the error saccade and the onset of the corrective saccade. For each participant, RTs for error and corrective saccades were binned into deciles. Decile means were averaged across subjects to create the group-averaged vincentized RT distributions. Inset, Mean RTs for corrective (solid bars) and error (striped bars) saccades are presented.

