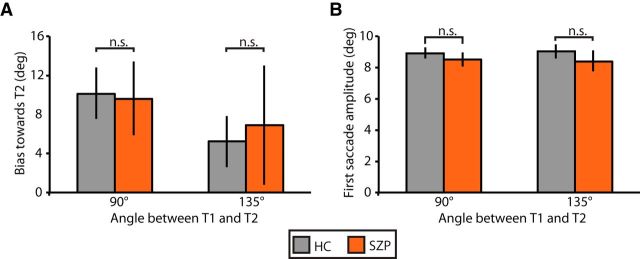
Figure 8.
Dynamics of first saccade on error double-step trials, separated by angle of target separation. A, Mean bias (±SE) in the first saccade vector angle in the direction of T2. B, Mean amplitude (±SE) of the first saccade in degrees of visual angle (right) for HCs (gray) and SZPs (orange). n.s., p > 0.05.

