
Fig. 2.
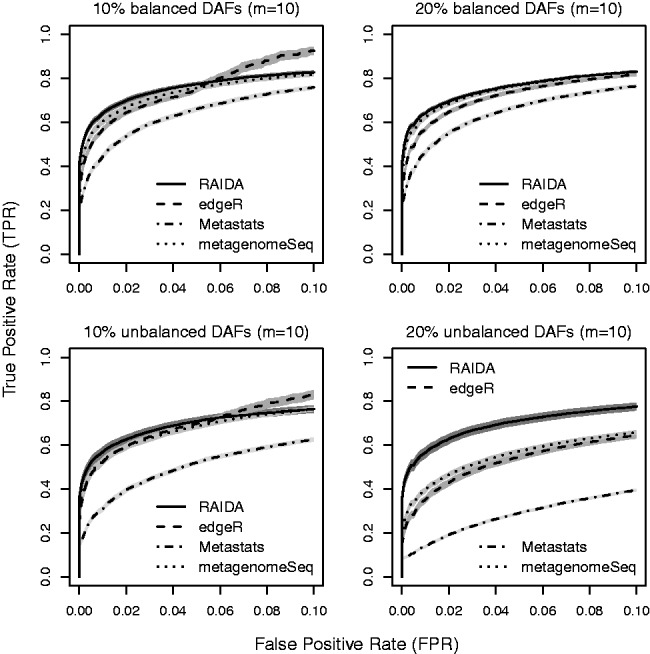
Partial of mean ROC curves for 10 and 20% of DAFs in the balanced and unbalanced conditions with 10 samples of each condition, based on 100 simulations with 1000 features. The shades around the lines are 95% confidence bands
Official websites use .gov
A
.gov website belongs to an official
government organization in the United States.
Secure .gov websites use HTTPS
A lock (
) or https:// means you've safely
connected to the .gov website. Share sensitive
information only on official, secure websites.
Partial of mean ROC curves for 10 and 20% of DAFs in the balanced and unbalanced conditions with 10 samples of each condition, based on 100 simulations with 1000 features. The shades around the lines are 95% confidence bands