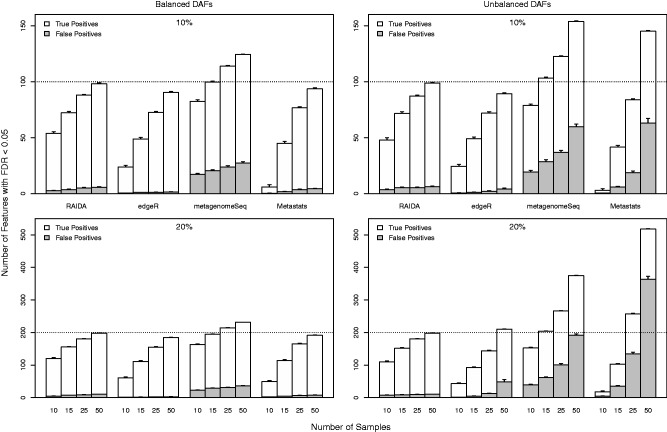
Fig. 4.
Mean true and false positives plots for 10 and 20% of DAFs in the balanced and unbalanced conditions at various numbers of samples, based on 100 simulations with 1000 features. Each bar represents the total number of features that are identified as statistically significant at FDR < 0.05. The white segments are the number of true positives and the gray segments are false positives. The error bars are at a significance level of 0.05. The dotted lines indicate true numbers of DAFs. The dashed lines represent the number of DAFs designed for each situation. For example, in ‘10%’ settings there are 100 DAFs out of 1000 features

