
Fig. 5.
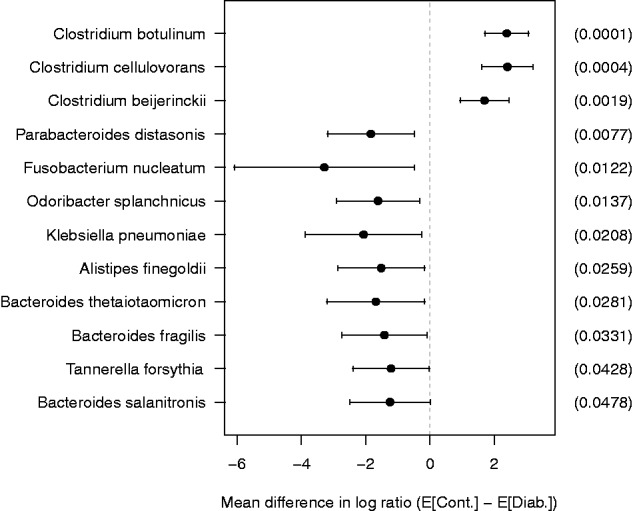
Plot of mean difference in log ratio with 95% confidence interval for the species whose P value <0.05. The mean difference is computed by subtracting the mean of diabetics from the mean of controls. The values in parentheses are raw P values
Official websites use .gov
A
.gov website belongs to an official
government organization in the United States.
Secure .gov websites use HTTPS
A lock (
) or https:// means you've safely
connected to the .gov website. Share sensitive
information only on official, secure websites.
Plot of mean difference in log ratio with 95% confidence interval for the species whose P value <0.05. The mean difference is computed by subtracting the mean of diabetics from the mean of controls. The values in parentheses are raw P values