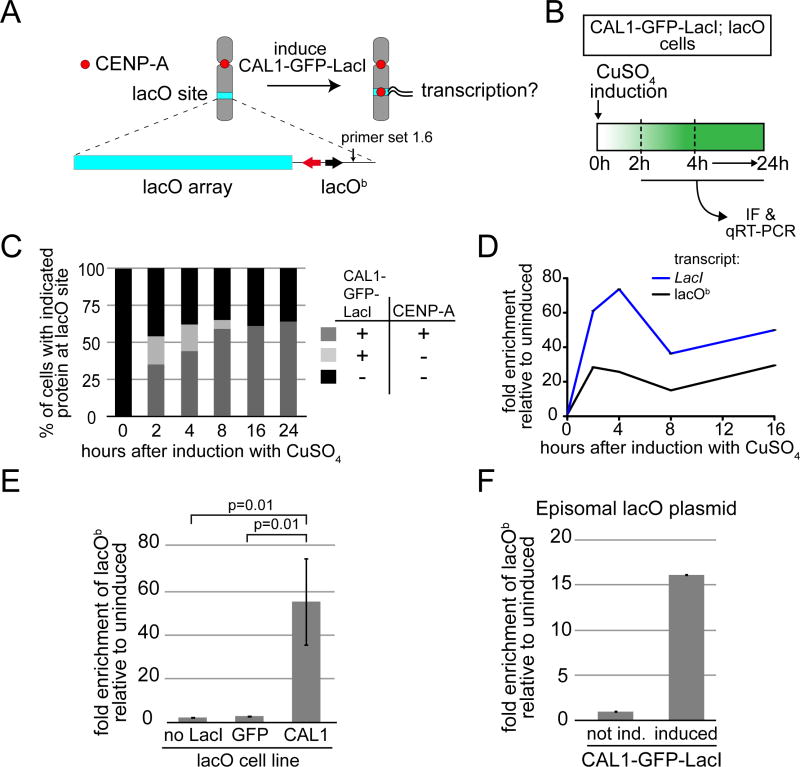
Figure 1. CENP-A deposition at the ectopic lacO site is associated with transcription.
A) Experimental approach to determine if transcription is coupled with CENP-A deposition. The lacO vector is stably inserted in S2 cells and contains 256 lacO repeats (lacO array; blue bar), the bacterial Amp resistance gene (black arrow), and the yeast TRP1 gene (red arrow). Primer set 1.6 (arrow) is within the lacO vector backbone (lacOb). B) Experimental strategy used to follow ectopic CENP-A deposition and transcription from lacOb after induction of CAL1-GFP-LacI. C) Quantification of the presence (+) or absence (−) of CAL1-GFP-LacI and CENP-A foci at the lacO site during a time course. n=100 cells for each time point. D) qRT-PCR analysis of lacOb (black) and CAL1-GFP-LacI transcripts (blue) in induced CAL1-GFP-LacI cells at the indicated times. Error bars, SD of 3 technical replicates. E) qRT-PCR measuring lacOb transcription after 24h induction in cell lines: lacO only (no LacI), lacO with GFP-LacI (GFP), and lacO with CAL1-GFP-LacI (CAL1). Shown are the means ±SD of 3 experiments. p=0.01, unpaired t-test. F) Transcription from lacOb determined by qRT-PCR in CAL1-GFP-LacI cells (induced 24h) where the lacO plasmid is episomal. Error bars, 95% CI of 3 technical replicates. See also Figure S1.

