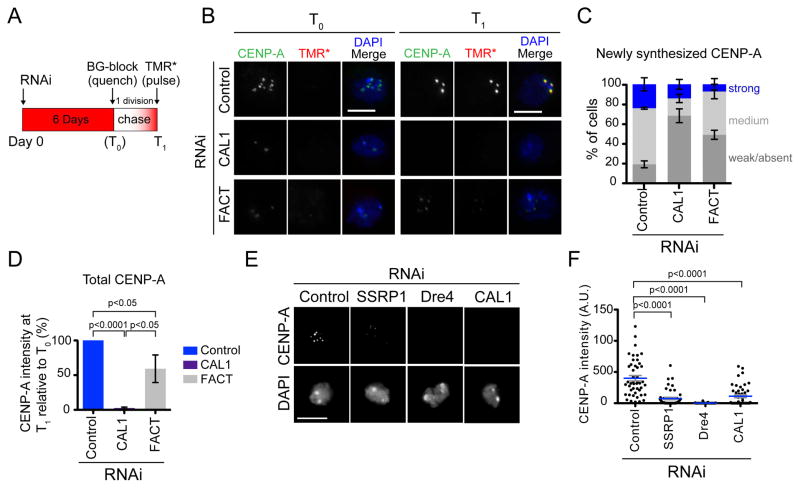
Figure 6. FACT is required for CENP-A recruitment at endogenous centromeres.
A) Diagram of the quench-chase-pulse experiment. B) IF with anti-CENP-A antibodies (green) in control and Dre4/SSRP1 RNAi SNAP-CENP-A cells pulsed with TMR* (red) immediately after BG-block (T0, left panel) or after having completed one cell division (T1, right panel). DAPI is shown in blue. Bars 5μm. C) Quantification of the signal intensity of TMR*-labeled CENP-A foci. Shown are the means ±SEM of 3 experiments (100 cells quantified per RNAi treatment). p<0.0001 for control versus SSRP1/Dre4 RNAi (unpaired t-test. D) The total CENP-A centromeric intensity for control cells, CAL1 RNAi cells, and SSRP/Dre4 RNAi (FACT) was quantified at T0 and T1. Shown is the mean change in CENP-A intensity at T1 relative to T0 ±SEM. n=3 experiments (150 cells each RNAi treatment). Unpaired t-test p-values are shown. E) IF with anti-CENP-A antibodies of S2 cells subjected to the indicated RNAi treatments. DNA is stained with DAPI. Bar 5μm. F) Scatter dot plot showing total centromeric CENP-A signal intensity per cell from the experiment in E. n=50 cells per condition. Unpaired t-test p-values are shown. See also Figure S4.

