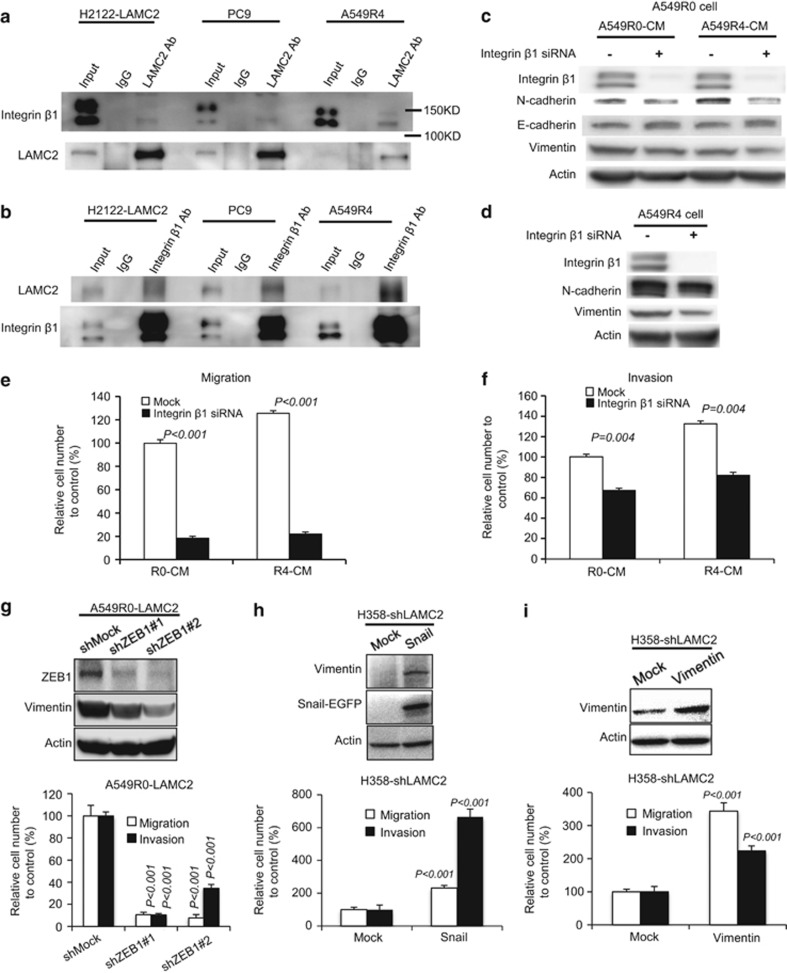
Figure 5.
LAMC2 promotes migration and invasion via integrin β1- and/or ZEB1-dependent EMT. (a and b) Co-immunoprecipitation of LAMC2 and integrin β1 in H2122-LAMC2, PC9, and A549R4 cells. Cell lysates were immunoprecipitated with anti-LAMC2 (a) or -integrin β1 antibodies (b). immunoglobulin G (IgG) was used as a negative control. The cell lysates and immunoprecipitates were analyzed by immunoblotting with the indicated antibodies. (c) A549R0 cells were pretreated with or without 25 nM integrin β1 siRNA for 48 h. The cells were then incubated with A549R0 conditioned media (R0-CM) or A549R4 conditioned media (R4-CM) for 24 h. Levels of integrin β1, N-cadherin, E-cadherin, and vimentin were detected by immunoblot analysis. (d) Western blot analyses of integrin β1, N-cadherin, and vimentin in A549R4 cells treated with or without 25 nM integrin β1 siRNA for 48 h. Actin was used as the loading control. (e and f) Cell migration (e) and invasion (f) assays of A549R0 cells. A549R0 cells were pretreated with or without 25 nM integrin β1 siRNA for 48 h, followed by incubation with the indicated conditioned media for 24 h. Cells were then collected for migration and invasion assays. Data are presented as mean±S.E.M. of triplicate experiments. Knockdown of integrin β1 significantly inhibits LAMC2-mediated migration (P<0.001) and invasion (P=0.004). (g) Knockdown of ZEB1 decreases migration and invasion of A549R0-LAMC2 cells. Student's t-test was performed to compare shMock cells and shZEB1 cells. Data are presented as mean±S.E.M. of triplicate experiments. (h) Ectopic expression of Snail restores migration and invasion in H358-shLAMC2 cells. Student's t-test was performed to compare Mock- and Snail-transfected cells. Data are presented as mean±S.E.M. of triplicate experiments. (i) Ectopic expression of vimentin restores migration and invasion in H358-shLAMC2 cells. Student's t-test was performed to compare Mock- and vimentin-transfected cells. Data are presented as mean±S.E.M. of triplicate experiments

