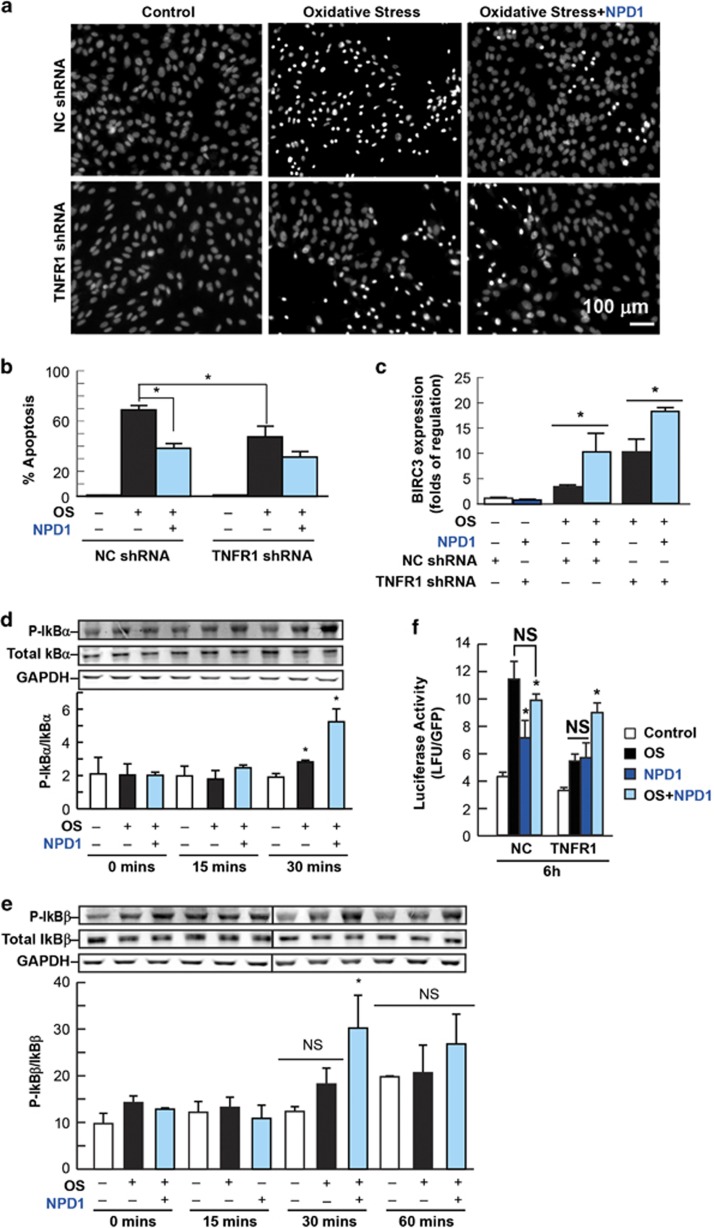
Figure 2.
TNFR1 stably-silenced cells display enhanced BIRC3 expression and cell survival upon oxidative stress (OS). (a and b) TNFR1 and NC shRNA-expressing ARPE-19 cells were subjected to OS in the presence or absence of NPD1. (a) Representative pictures and (b) quantification of apoptotic TNFR1 and NC shRNA-expressing cells in the presence or absence of 50 nM NPD1. (c) BIRC3 expression induced by NPD1 upon OS by the means of real-time PCR in TNFR1-deficient cells. (d and e) Western blot showing the time-dependent phosphorylation of (d) IkBα and (e) IkBβ after 0, 15, 30 and 60 min of OS treatment in the presence or absence of 100 nM NPD1. (f) NPD1 effects on canonical NF-κB activation measured by the means of luciferase reporter assay in OS conditions. OS: 600 μM H2O2/10 ng/ml TNF-α. NPD1: 100 nM. Bars represent the mean of triplicates ± standard error of the mean. *P<0.05, NS=non-significant P-value. NPD1 treated samples=blue bars; OS+NPD1=light blue bars

