Figure 3.
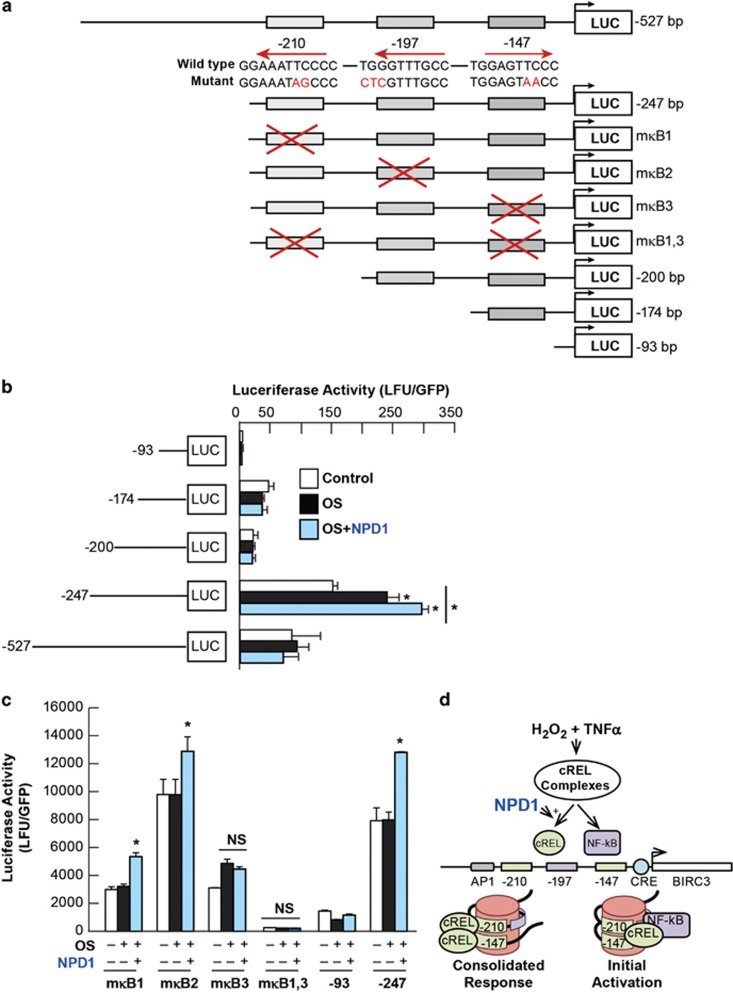
NPD1-mediated BIRC3 promoter activation. BIRC3 promoter was analyzed using a luciferase reporter assay. (a) Schematic representation of the constructs used for deletion and mutation. (b) BIRC3 promoter deletion analysis using constructs containing 527, 247, 200, 174 and 93 bp (depicted in a) upstream of the transcription start site. Transfected cells were treated with 130 μM H2O2/10 ng/ml TNF-α in the presence or absence of 200 nM NPD1. (c) Site directed mutation analysis on the NF-κB sites. Cells were treated with 400 μM H2O2/10 ng/ml TNF-α in the presence or absence of 200 nM NPD1. (d) Luciferase activity was standardized by GFP fluorescence. Bars represent the mean of triplicates ± standard error of the mean. *P<0.05, NS=non-significant P-value. NPD1-treated samples=blue bars; OS+NPD1=light blue bars

