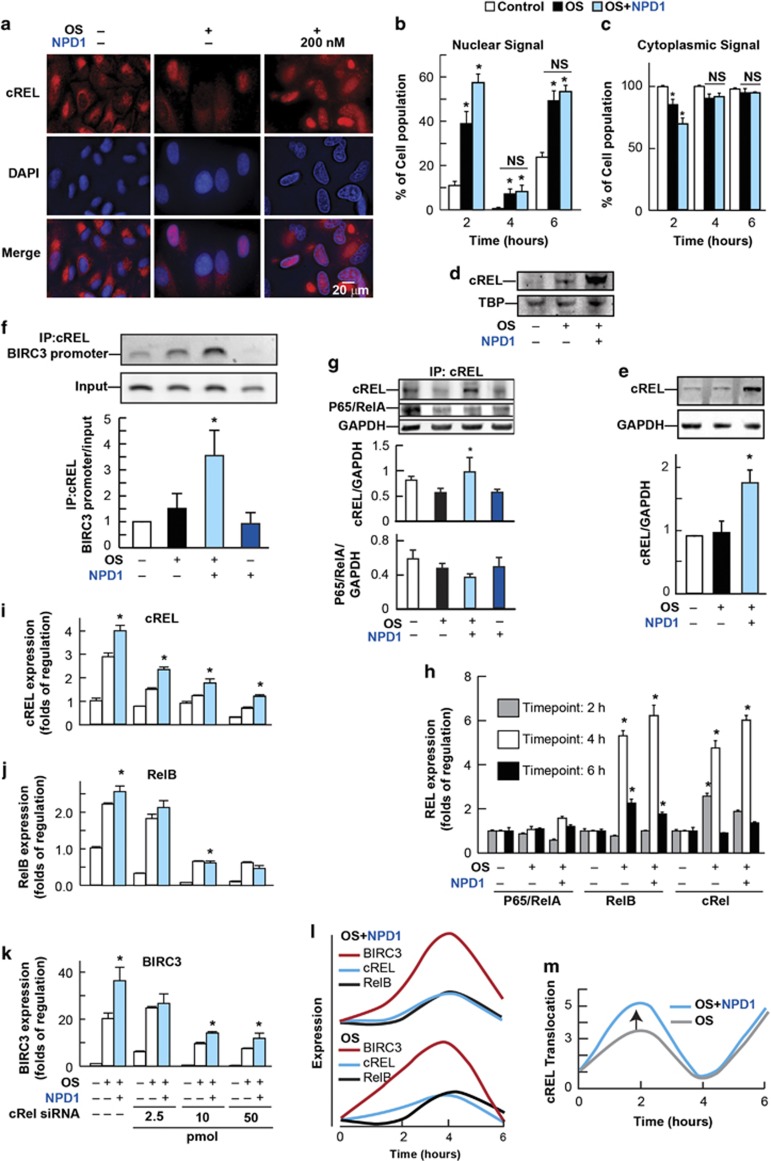
Figure 4.
cREL nuclear translocation and binding to BIRC3 promoter to induce the activation of its expression. Changes of distribution, activity and expression of cRel were assessed at three time points (2, 4 and 6 h) in ARPE-19 cells treated with 400 μM H2O2/10 ng/ml TNF-α in the presence or absence of 100 nM NPD1. (a–c) Immunocytochemistry of cREL in cells: (a) representative pictures showing the distribution of the cREL signal (red). Nuclei were stained with DAPI (blue). (b and c) Portion of cells depicting cREL nuclear or cytoplasmic signal. (d and e) cREL protein content evaluated by western blot (d) in the nuclear fraction standardized using TBP at 2 h and (e) in whole cells standardized by GAPDH after 4 h of OS or OS+NPD1. (f) ChiP assay at 4 h showing the binding of cREL to BIRC3 promoter. The co-immunoprecipitated genomic DNA was amplified and standardized by the input. (g) Co-immunoprecipitation of cREL and p65/RelA at 4 h of treatment standardized by GAPDH. (h) p65/RelA, RelB and cRel expression determined by real-time PCR. (i–k) Silencing of cRel induced changes in the expression of: (i) cREL, (j) RelB and (k) BIRC3 in human RPE (hRPE) cells established by the means of real-time PCR. Concentrations of 2.5, 10 and 50 pmol siRNA per ml of cell culture medium were used to show a concentration-dependent effect on the expression at 4 h. (l and m) Schematization of the temporal pattern of (l) cREL, RelB and BIRC3 expression and (m) cREL translocation. The values are represented as the mean of triplicates ± the standard error. *P<0.05, NS=non-significant P-value. NPD1-treated samples=blue bars; OS+NPD1=light blue bars

