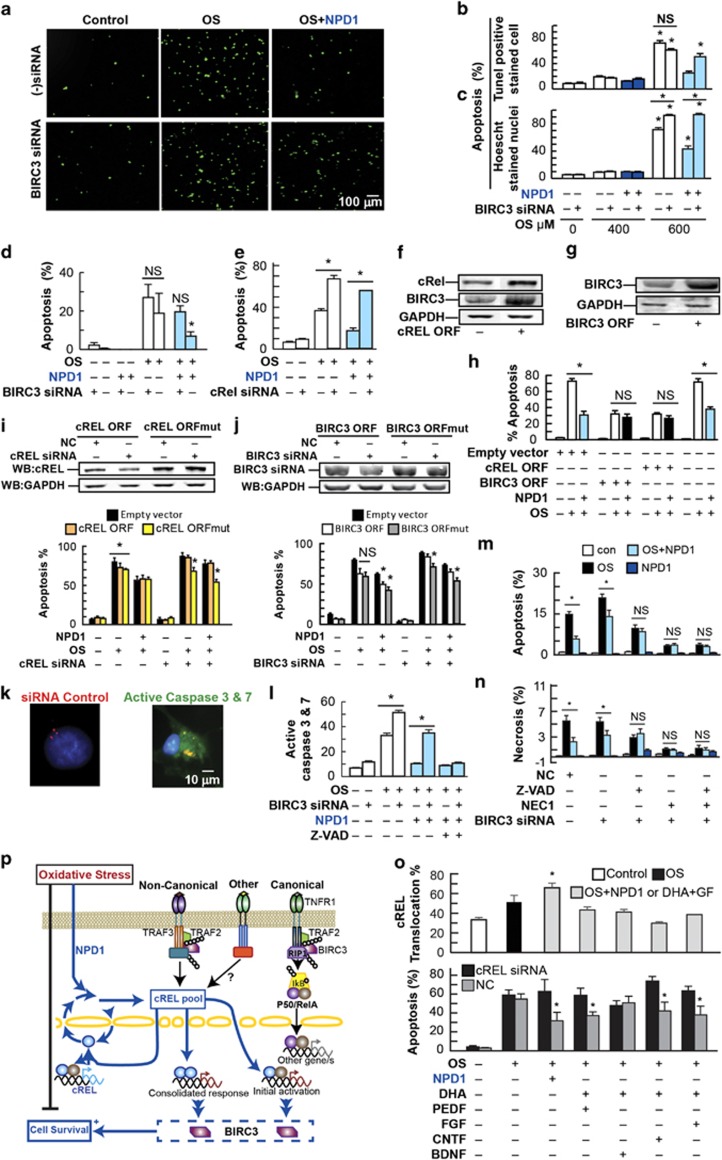
Figure 5.
NPD1 fails to rescue BIRC3 silenced cells. (a–e) Apoptosis noted as percentage of Hoechst- or TUNEL-positive cells was assessed on ARPE-19 (a–c) or primary human RPE (hRPE) cells (d and e). (a) Representative images of TUNEL staining performed on ARPE-19 cells, (b and c) Quantification of TUNEL and Hoechst-positive cells when transfected with BIRC3 or control siRNA and treated with 0, 400 and 600 μM H2O2/10 ng/ml TNF-α with or without 200 nM NPD1. BIRC3 (d), cREL (e) or control siRNA-transfected hRPE cells treated with 600 μM H2O2/10 ng/ml TNF-α in the presence or absence of NPD1 100 nM. cREL and BIRC3 (f) and BIRC3 (g) protein content when cREL and BIRC3, respectively, were overexpressed. (h) Percentage of apoptosis in ARPE-19 cells overexpressing cREL or BIRC3 when confronted with OS in the presence or absence of NPD1. (i and j) Overexpression of (i) cREL or (j) BIRC3 using a wild-type open reading frame (ORF) or one carrying silent mutations at the siRNAs binding sites (ORFmut) to prevent its silencing and rescue from the knocked down phenotype. Upper panels show representative western blots for the corresponding protein content in each sample. Lower panels depict percentage of apoptosis for each treatment. (k and l) Activation of effector caspases 3 and 7 as a result of OS treatment in BIRC3-silenced cells. (k) Representative nuclei and staining of cells: upper panel, control; lower panel, OS. (m and n) Apoptosis and necrosis measured by the means of AnnexinV and 7-Amino actinomycinD when cells were treated with OS and NPD1 in the presence of z-VAD, a pan caspase inhibitor or Necrostatin 1 (Nec1). (o) cREL translocation (upper panel) and percentage of apoptosis of control and cREL-silenced (lower panel) ARPE-19 cells subjected to OS with the addition NPD1 or DHA plus 10 ng/ml of PEDF, FGF, CNTF or BDNF to endogenously induce NPD1 synthesis. (p) Schematization of the model obtained by the integration of the data obtained in this report and the context. Bars represent the mean of triplicates+standard error of the mean. *P<0.05 NS=non-significant P-value. NPD1-treated samples=blue bars; OS+NPD1=light blue bars; DHA+growth factors=teal bars; OS+DHA+growth factors=light teal bars

