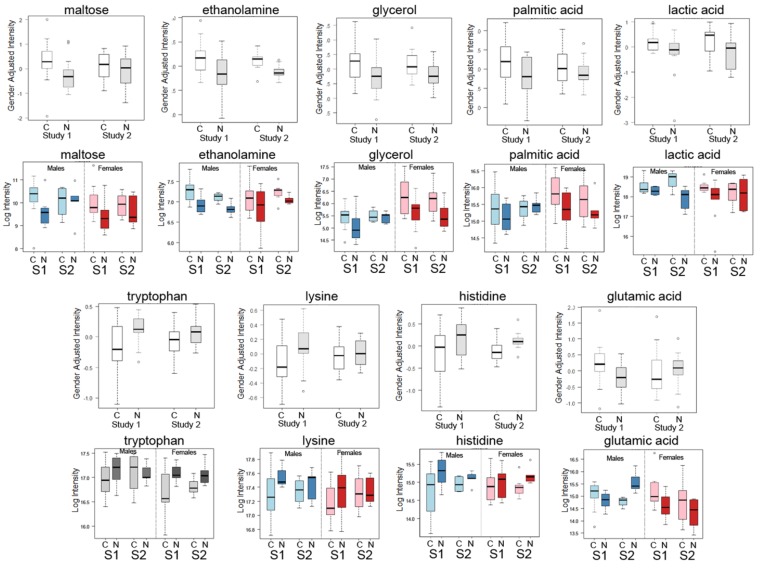
Figure 1.
Box-whisker plots of top metabolite candidates in Study 1 and Study 2 with additional plots of the same metabolites from each study separated by gender (males and females). Box-whisker plots of gender adjusted intensities of top known metabolite candidates from Study 1 (S1) compared with the same compounds in Study 2 (S2) for cancer cases (C) and normal/control (N) showing similarity in the changes in both studies are shown for nine of the top metabolites: maltose, ethanolamine, glycerol, palmitic acid, lactic acid, tryptophan, lysine, histidine and glutamic acid. Shown below each metabolite plot are results for the same metabolites separated by gender. Blue plots denotes male results only and red plots denote females results only for each study.

