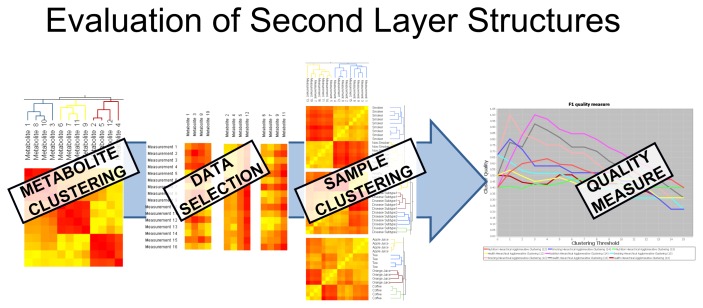
Figure 2.
The subset selection allows for the analysis of the hidden structures in the data. Steps 2–4 from Figure 1 are repeated on a selected subset (or all subsets). Here, we separate artificial data with respect to the metabolite clusters discovered in the first layer. The second layer clustering of the samples (patients) now evaluates the association of each metabolite cluster to selected patient annotations (i.e., labels; here: “health”, “nutrition” and “smoking”). Finally, the F-measure plots show to what extent the metabolite clusters “explain” the different labels.

