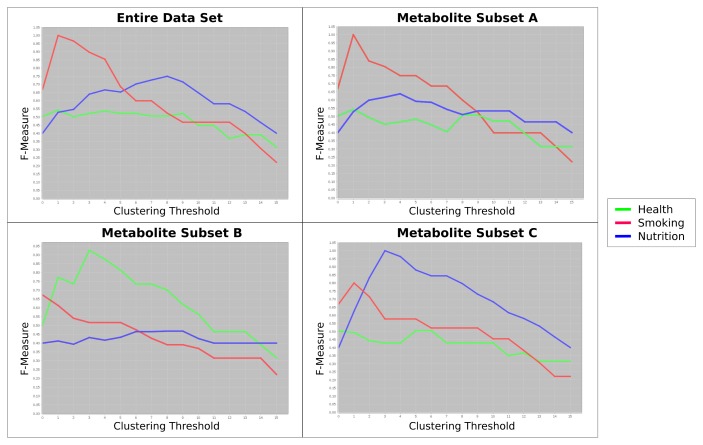
Figure 4.
Carotta’s final output. The top left plots show the F-measure for different clustering thresholds on the full dataset, containing all metabolites. We observe a dominant effect of the confounder “smoking”, which overlays the main outcome variable “health”. The other three plots show the F-measure behavior over different thresholds for each cluster of correlated metabolites separately. They clearly reflect and dissect the labels “health”, “smoking” and “nutrition” now.

