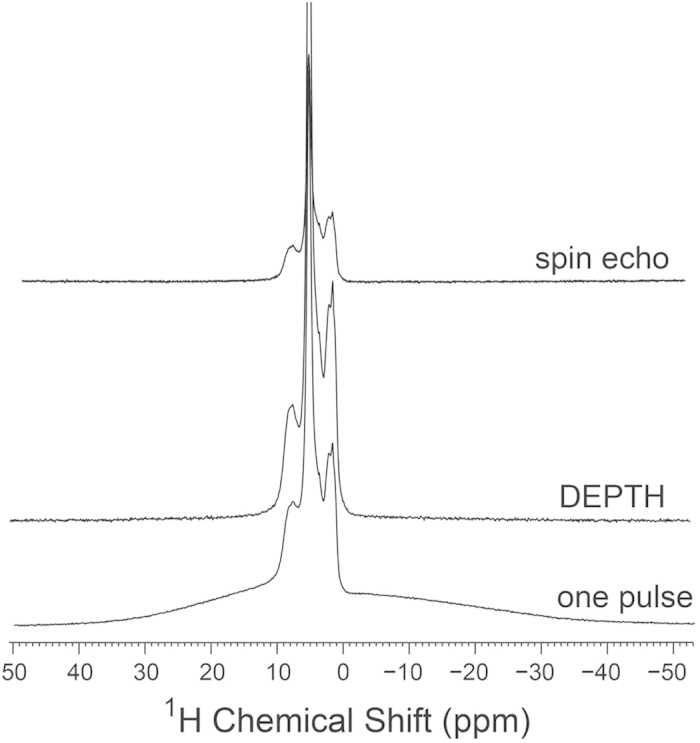
Figure 2. 1H MAS NMR spectra of bovine cortical bone at 14.1 T (600.17 MHz 1H Larmor frequency) with 110 kHz MAS frequency.

The spectra were acquired with either a 1H one-pulse excitation (bottom), a DEPTH pulse sequence (middle), or a rotor-synchronized spin-echo (top), using a 0.75-mm MAS HX probe with a 0.72 μs π/2 1H-pulse, a 3 s recycle delay. 16 transients were collected for each of the one-pulse and DEPTH spectra while the spin-echo spectrum was acquired in 4 transients.
