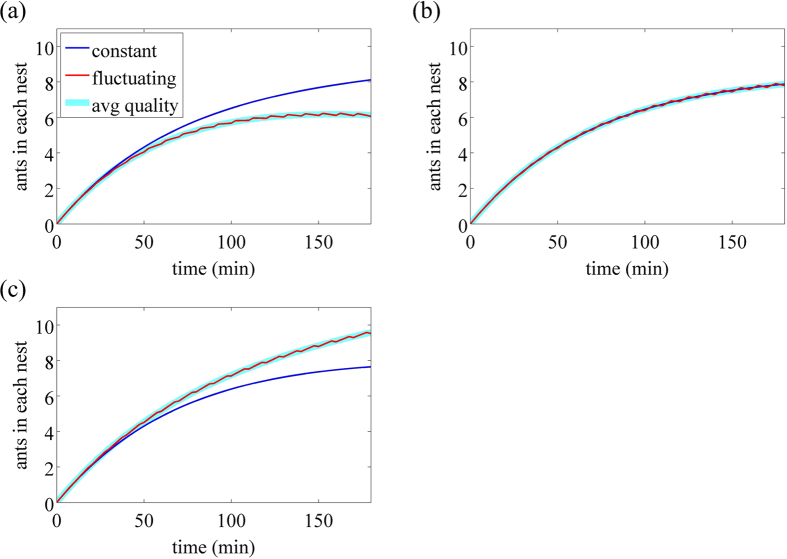
Figure 6.
Time courses of the number of ants in each nest for (a) 25% G : 75% P, (b) 50% G : 50% P, (c) 75% G : 25% P. One of the advantages of the mathematical modelling is that we can run the model for exactly the average properties of the FN. Hence we can plot the results for such a constant-quality nest, which we call Average Nest (AN), the quality parameters of which are set to the running average of those for the FN. The blue and red lines represent the number of ants in the CN and FN, respectively. The cyan lines represent the number of ants in the AN when the colony is presented with the AN and CN. The time courses for the CN under this condition are omitted because they almost completely overlap with those for the CN when the FN and CN are presented (i.e., blue lines). In (b), all three lines overlap heavily with each other.

